



How long will recent PE fund vintages keep returning at a fast clip?
One of the ongoing narratives presented by recent private equity fund returns data has been the recovery of vintages most impacted by the recession. As is evidenced by the chart above, the average distributions-to-paid-in multiple of 2007 and 2008 vintages have benefited considerably from the past few years’ selling frenzy, with a high-priced M&A environment in particular helping boost distributions back to limited partners. More youthful vintages haven’t missed out either: 2009 and 2011 vintage numbers are posting significant gains in DPI multiples as well. These numbers do contain some implications, however, ranging from the fact they are averages to the current liquidity backdrop.
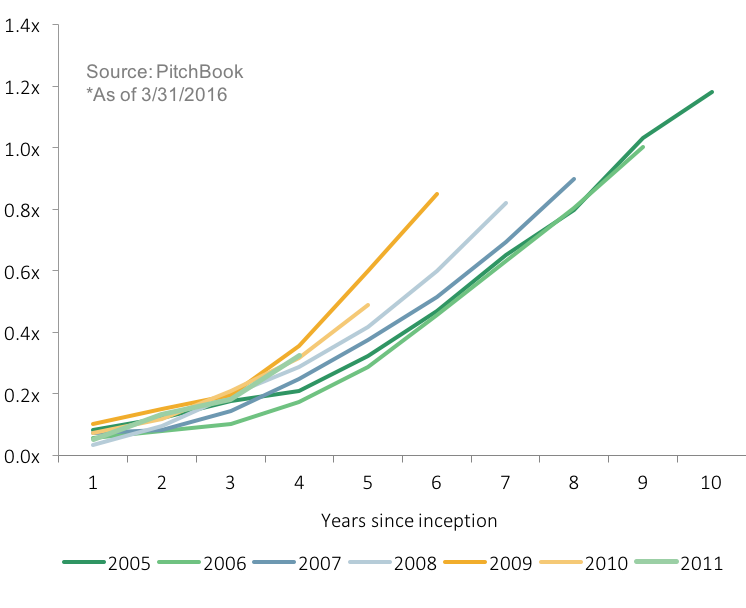
For starters, average DPI multiples are skewed by a cluster of high-performing funds—particularly those of the younger vintages—and accordingly these figures should not be taken as indicators of the industry’s performance overall, but rather as evidence that many PE fund managers have been able to perform well, which of course will only further encourage LPs to concentrate their capital commitments among fewer, higher-performing firms. Furthermore, PE-backed exit activity has lost some of its steam as of late, even if value has remained within historical norms. Should it persist for some time longer, the M&A boom could still produce some significantly lucrative wins for PE funds, but it seems likeliest for now that it winds down slowly throughout 2017. This will contribute to recent PE fund vintages’ liquidity timelines stretching out further, interrupting the flow of cash back to LP coffers. This could prove something of a problem for those funds that haven’t yet capitalized fully on the exit environment, although some have already begun to prepare for such an eventuality by baking in longer lifecycles into forecasts. But in the meanwhile, plenty of sellers looking to take advantage of the current environment while it lasts are to be expected in the marketplace. Such a crowded scene will push the spread between the quality of companies out further, producing more gains for some vintage and consequently average DPI multiples in general, but eventually, those metrics will stall once the supply of quality companies declines. Consequently, the trailing average DPI multiples of funds from the 2010 and 2011 vintages are likely to see the tail ends of their liquidity periods prolong well past six to seven years.
Read PitchBook’s 1Q 2016 Global PE & VC Benchmarking & Fund Performance Report here.
Contact: Garrett Black
garrett.black@pitchbook.com




Latest news

US leveraged loans returns turn negative in October
The Bloomberg US Leveraged Loan Index (Ticker: LOAN) has returned -0.26% this month through October 21, reducing its year-to-date return…

M&A activity begins to tick upward
In the third quarter of 2026, acquisition-linked loan volume across North America and Europe reached about $47 billion, up from $30.6 billion in Q2 and $29.5 billion a year ago.
