



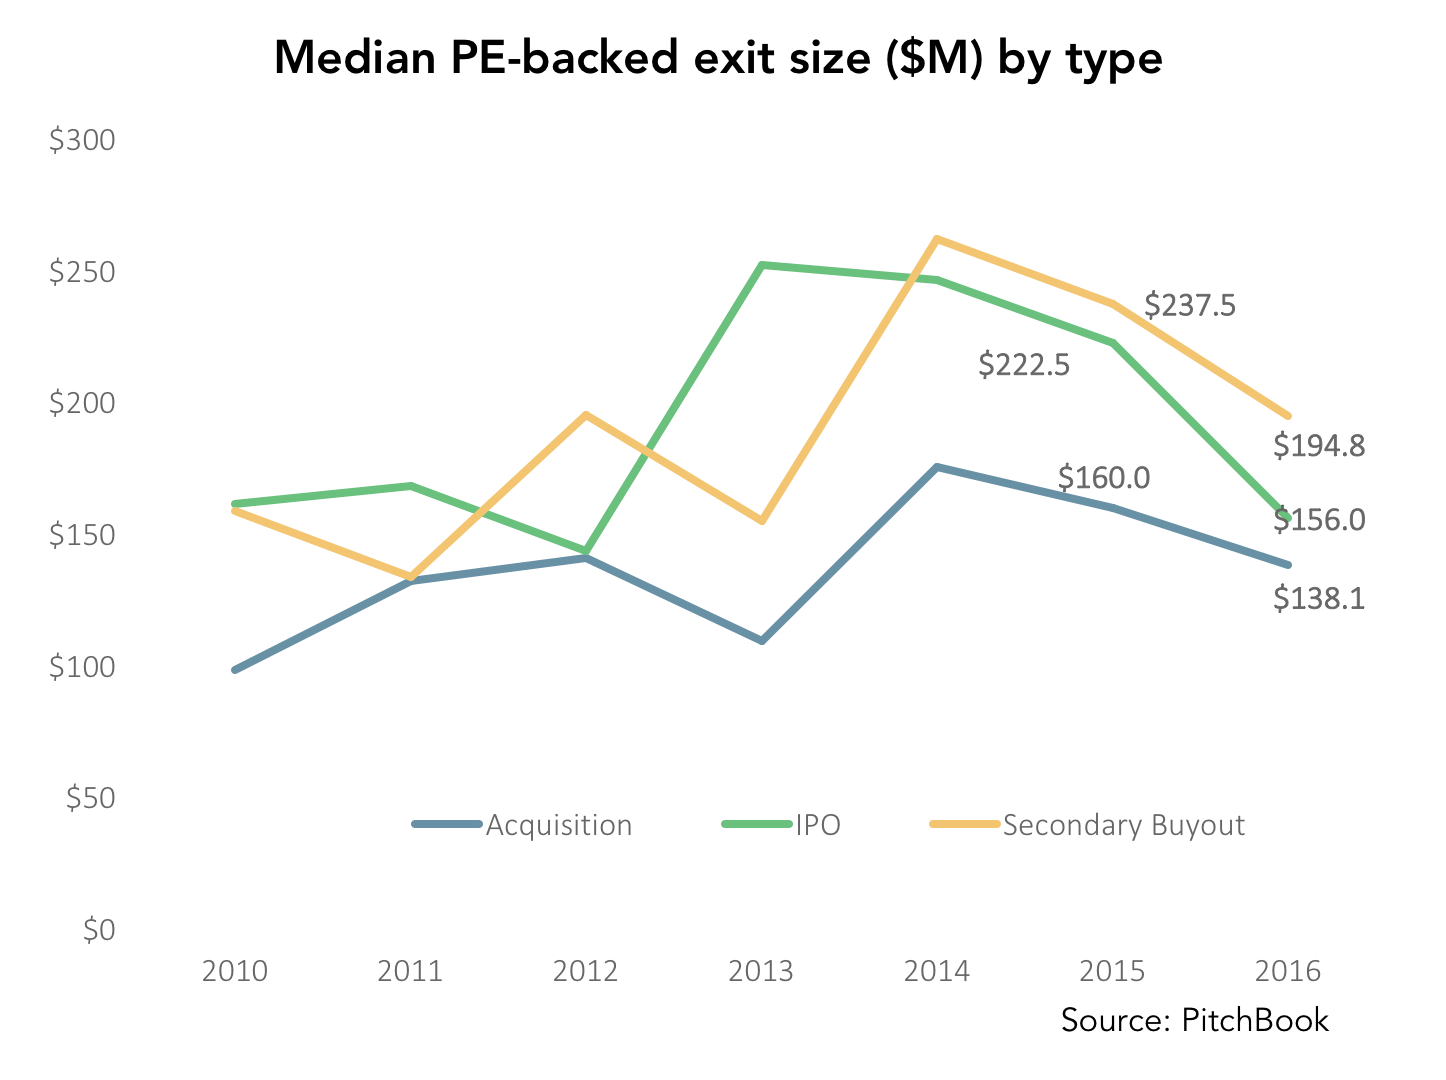
For the second year in a row, the median private equity-backed exit in North America and Europe has trended downward in size across all three primary routes of liquidity. The typical corporate acquisition in 2016 cleared $138.1 million, a 13.7% decline from the $160 million notched in 2015. After the significant growth in median exit sizes from roughly 2013 to 2015, it is important to note that the numbers recorded in 2016 were still aligned somewhat with those seen in 2010 and 2011. Given that these figures are still relatively healthy on a historical basis, the drivers behind the decline aren’t so much systemic as cyclical. As exit volumes have declined steadily over the past few quarters, it’s likeliest that both supply and market valuations took a toll—the supply of PE portfolio companies that could come to market and justify the typical level of valuations necessarily diminished after most of the best-prepared businesses were sold off from 2013 to 2015. Moreover, sector-specific dynamics have come into play across the same period, with PE buyers moving into lower reaches of the middle market in search of consolidating fragmented providers in healthcare as well as insurance. As the prevalence of secondary buyouts has continued at a fair clip, the relatively steeper decline in their median size accordingly makes sense, since larger or more specialized PE firms are snapping up the smaller yet built-out platforms of those PE managers that engaged in the initial buying and building. Of course, the most dramatic slump in size of them all—that of initial public offerings backed by PE investors—is part and parcel of the doldrums observed in the IPO market in general. 2016 was simply marked by an untoward uptick of volatility in public markets, whether driven by political or economic events, which only encouraged wariness on the part of both investors and businesses looking to list. Those that did, accordingly, tended to be smaller and not quite as exposed to critical pressures derived from political occurrences or economic trends.
View PitchBook’s 2016 Annual US PE Middle Market Report here.




Latest news

US leveraged loans returns turn negative in October
The Bloomberg US Leveraged Loan Index (Ticker: LOAN) has returned -0.26% this month through October 21, reducing its year-to-date return…

M&A activity begins to tick upward
In the third quarter of 2026, acquisition-linked loan volume across North America and Europe reached about $47 billion, up from $30.6 billion in Q2 and $29.5 billion a year ago.
