



On a long enough horizon, returns for PE funds of all sizes converge
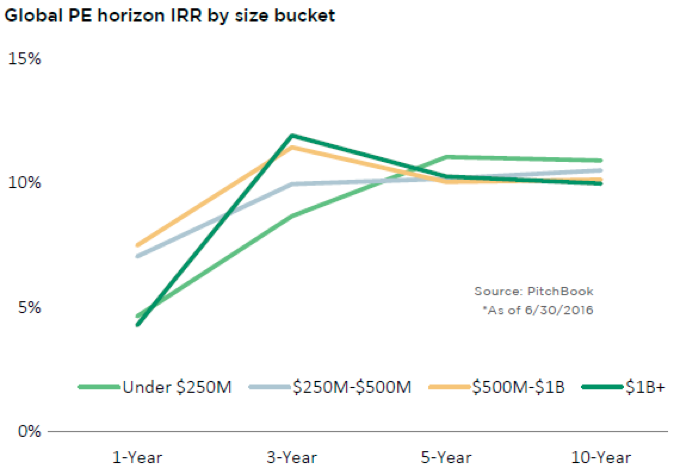
By and large, the macroeconomic environment remains the most significant factor to bear in mind when assessing long-term private equity fund performance. Given the impact of the financial crisis, it makes sense that no matter the size of the fund in question, at the longest time horizon—10 years—internal rates of return (IRRs) have by and large converged. Following the typical J-curve of fund performance, at that point in the conventional fund lifecycle most assets that end up contributing to the majority of a fund’s return have already been sold, so a plateau of IRR is also to be expected. The shorter term is where the greatest disparities in performance by fund size class lie, mainly owing to liquidation timelines as well as operational resources. Larger funds, such as those exceeding $1 billion in size, can often purchase a company from a fellow PE sponsor that has already made considerable improvements to the extent of its abilities and resources, and then bring its greater arsenal of either industry specialization or operational resources to bear. This in turn can end up in a shorter holding period and relatively swifter exit, as the larger fund simply doesn’t need as much time given the potential extent of advance work (so to speak) the prior PE backer has accomplished. The same phenomenon can occur with funds of other size ranges, until reaching the typical middle-market fund size range. For funds sized $500 million or below, comparably lower IRRs at the one- and three-year horizons are explained by the necessarily longer holding periods needed to tune up various business functions as well as the potential for exit. It’s a consequence that is oft-implied but worth noting that scaling up a firm to a sellable size also takes time, whether the intended buyer be a strategic acquirer or a fellow PE fund.




Latest news

US leveraged loans returns turn negative in October
The Bloomberg US Leveraged Loan Index (Ticker: LOAN) has returned -0.26% this month through October 21, reducing its year-to-date return…

M&A activity begins to tick upward
In the third quarter of 2026, acquisition-linked loan volume across North America and Europe reached about $47 billion, up from $30.6 billion in Q2 and $29.5 billion a year ago.
