



Cyclicality of PE industry coming to bear?
View PitchBook’s 2017 Global PE & VC Fund Benchmarking Report: Part II Here
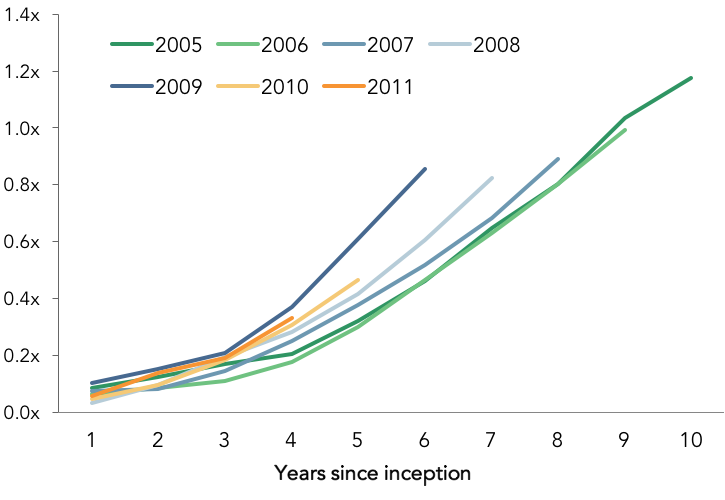
From the rhythmic ebb and flow of the tide to the mysterious circadian patterns within each human, the world is governed by cycles. When it comes to private equity investment and fundraising, multiple separate cycles overlap to produce headline trends, ranging from the longer-term credit cycle to the typical business cycle within a given region. The rate at which general partners return capital to their investors over time (distributed-to-paid-in or DPI multiples is the typical metric) is one of the more interesting trends to tease out, as it is illustrative of liquidity, hold periods, the investing cycle and the broader economic environment, all in concert. The greater the slope of a given line in the chart above, the more swiftly the average PE fund from that vintage is returning capital to its limited partners. For example, the soaring curve of the 2005 figure indicates how funds from that era cashed in on the buyout boom prior to the financial crisis, in addition to the simple reality that so much time has elapsed since their inception the mean vehicle could recoup any losses and return over time.
More recent vintages, however, hint at more intriguing findings. The average 2009 vintage has clearly outpaced its immediate predecessors of 2007 and 2008 in terms of returning capital to its investors, likely due to funds from that year benefiting from the timing of slow-paced economic recovery, as well as the early period of the M&A bull market and once-thriving IPO environment. However, more recent if not exactly youthful vintages, such as 2010 and 2011, are not quite matching the performance of vehicles from 2009. The spread is slight enough one could ascribe some of it to sluggish reporting by LPs, but what it also portends is the inevitable cyclicality of the PE industry. Fund managers took full advantage of the sellers’ market over the past few years, exiting investments they bought at more reasonable valuations in the immediate aftermath of the financial crisis, thus boosting typical returns and returning cash to investors quickly. Now, however, exit avenues aren’t as packed due to a variety of factors, chief among them refilling PE portfolios, timing and relatively high valuations. Especially as more youthful funds also weren’t able to snag such favorably priced assets, their momentum and eventual time taken to post DPI figures similar to those of 2009 look set to be slower and longer, respectively.
Contact: Garrett Black
garrett.black@pitchbook.com


Latest news

Share of PE middle-market deal count by backing type
Add-ons remain the workhorse for middle-market deployment, accounting for 67. 1% of all middle-market transactions YTD, in line with activity seen in recent years.

Software deal share falls in middle markets, rises in large caps
In Q3’26 software’s share of total deals fell in both the Lower Middle Market (to 7%) and Upper Middle Market (to 9%), while Large Cap saw a modest uptick in share to 8%.

Secondary loan prices stabilize following steep declines
Secondary loan prices came under significant pressure through September and October, with the Bloomberg U.S. Leveraged Loan Index declining 119…