



Download PitchBook’s Report click here.
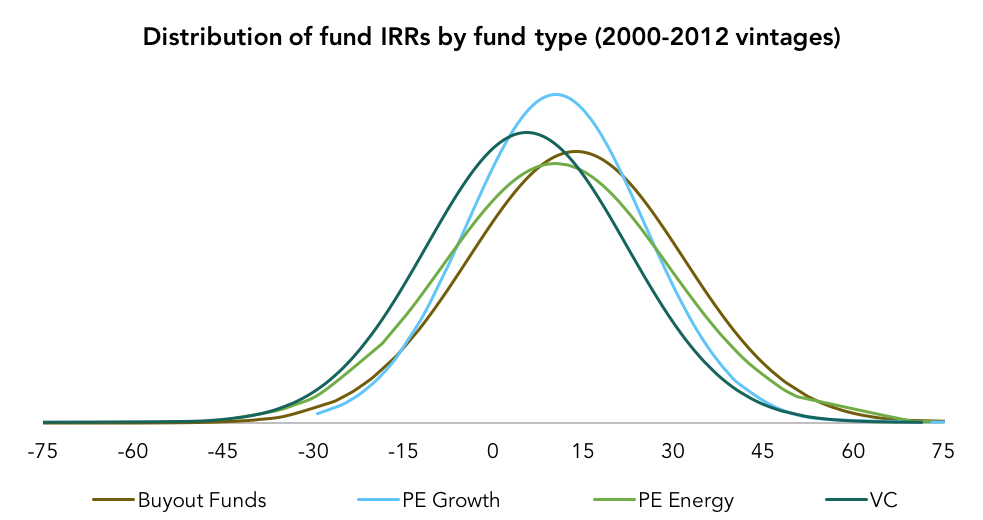
How do private asset classes compare on a real and risk-adjusted basis? Our latest analyst note (Is the risk worth the wait?) gauged the risk/return profile of buyout funds between 2000 and 2012 against PE growth, PE energy and venture capital strategies, and found that buyout funds were the best performers on a real returns basis with a median IRR of 12.4%. On a risk-adjusted basis, distressed debt funds were the high-water mark at 10.1% (median) with a standard deviation of 11.0%. On the surface it would seem that distressed fund returns would carry with them higher variations in returns, given the inherent risks in the strategy. As the strategy has matured over the years, however, we shouldn’t be as surprised to see lower variations in distressed as compared to other strategies; distressed investors have become much better at identifying turnaround opportunities with the most potential, and structuring those deals with minimal downside risk while maximizing upside opportunity. Distressed investors have two major levers they can pull to increase its upside—the size of the discount they can command, depending on the assets, and the creative adjustments they can make to the investment’s capital structure itself.
At least on a relative basis, manager selection is less critical (though still important!) for buyout and distressed strategies compared to venture funds, which showed the worst returns of all on both a real and risk-adjusted basis.
Contact: Alex Lykken
alex.lykken@pitchbook.com


Latest news

Share of PE middle-market deal count by backing type
Add-ons remain the workhorse for middle-market deployment, accounting for 67. 1% of all middle-market transactions YTD, in line with activity seen in recent years.

Software deal share falls in middle markets, rises in large caps
In Q3’26 software’s share of total deals fell in both the Lower Middle Market (to 7%) and Upper Middle Market (to 9%), while Large Cap saw a modest uptick in share to 8%.

Secondary loan prices stabilize following steep declines
Secondary loan prices came under significant pressure through September and October, with the Bloomberg U.S. Leveraged Loan Index declining 119…