



Download PitchBook’s report click here.
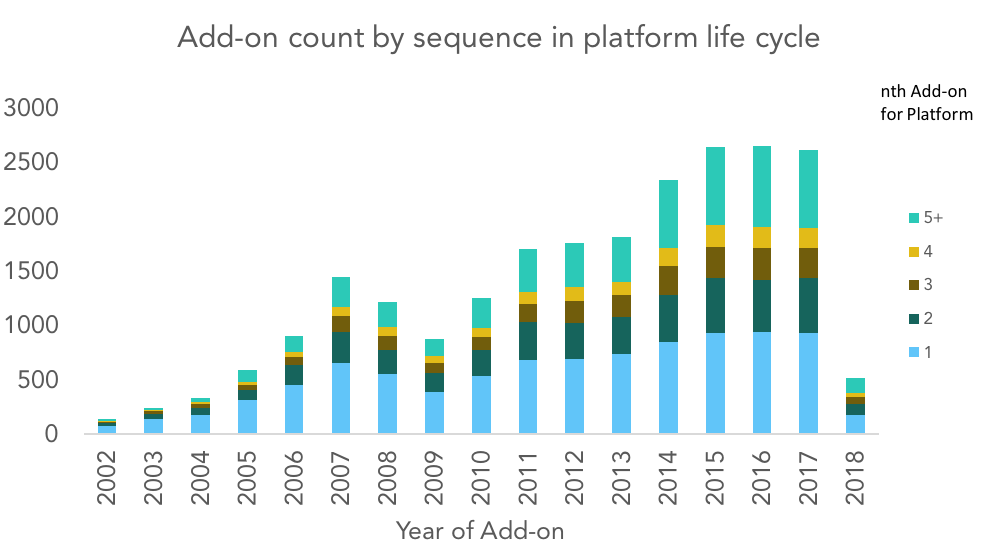
The buy-and-build strategy has largely displaced private equity’s early playbook, which relied on financial engineering and ambitious leveraging to generate profits. To be sure, add-ons have been in PE’s playbook even before the crisis, though to a much smaller degree. Prior to 2009, about half of add-on transactions were “one-and-done’s”—that is, the PE sponsors that did add to their platforms usually did so only once or twice before exiting. Starting around 2010, the number of third, fourth and fifth add-ons per platform began to gain in popularity. The accompanying chart shows how visible this change has become, especially the 5+ category starting in 2014. Roughly a quarter of all 2014-and-later add-ons reflect at least the fifth add-on done per platform. It’s worth noting that among the most active acquirers is a concentrated group of platforms that have been the driving force behind the recent boom—more than 10% of the most recent transactions represented at least the tenth add-on for their respective platforms.
Buy-and-build is most prevalent in highly fragmented industries. Insurance makes for a striking example, with platforms like Hub International completing more than 200 acquisitions under PE ownership. Confie Seguros is another—owned by ABRY Partners, Confie has made more than 100 add-ons since being acquired in 2012. California-based, Confie was a relatively small outfit six years ago, but now boasts a national footprint geared toward the underserved Hispanic market. Rumors of a sale back in 2015 put its price tag at $1.6 billion, quite a long way from its humble beginnings in Huntington Beach. Confie’s experience is similar to other platforms, which have acquired thousands of smaller businesses (often with a dozen or less employees) that fetch much cheaper valuations and help blend down the multiples paid for the original platforms. Many add-ons are now agreed upon before the platform is even acquired.
Private equity’s massive shift toward the buy-and-build model has had broad ramifications. Beyond the changes to its playbook, add-ons have contributed to longer holding periods for the platforms themselves. This makes sense, given the time and effort needed to fully integrate each new company into its new home. Historically, it has taken investors about a year longer to exit investments that made add-ons under PE ownership compared to ones that have not. Not surprisingly, hold times are even longer for platforms with multiple add-ons. While the benefits of buy-and-build seem to outweigh the negatives, LPs should note that this shift is impacting fund timelines across the board.
Contact: Alex Lykken
alex.lykken@pitchbook.com




Latest news

US leveraged loans returns turn negative in October
The Bloomberg US Leveraged Loan Index (Ticker: LOAN) has returned -0.26% this month through October 21, reducing its year-to-date return…

M&A activity begins to tick upward
In the third quarter of 2026, acquisition-linked loan volume across North America and Europe reached about $47 billion, up from $30.6 billion in Q2 and $29.5 billion a year ago.
