



The average yield assuming a three year term to repayment, on first-lien institutional tranches is at 5.56 percent so far in 3Q14, up from 5.17 percent in 2Q14. Moreover, 30 percent of first-lien term loans have priced at a yield of 6 percent or above, up from 18 percent last quarter. Meanwhile, 41 percent of the deals have a yield of less than 5 percent, down from 52 percent in 2Q14.
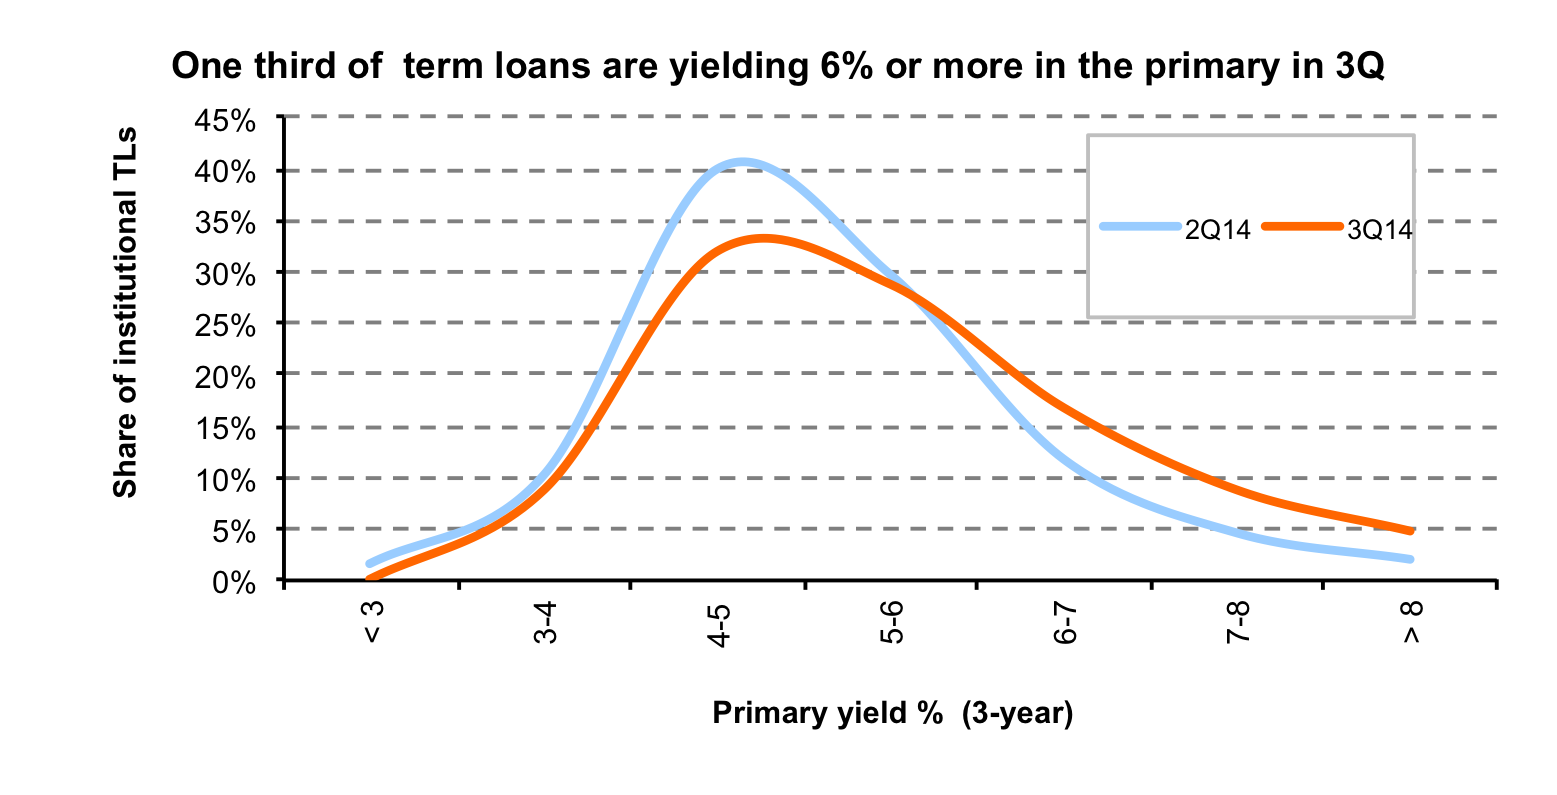 The shift came as the loan market reacted to global volatility and investors took a step back. In August a few deals were postponed and many had to sweeten terms before crossing the finish line. Twenty three first-lien institutional term loans flexed up in August, surpassing this year’s previous record of 22 upward flexes in both April and May. In contrast, only 5 deals were flexed down. In turn upward price flexes outnumbered downward price flexes by 4.6:1. This is a complete reversal of the trends seen in the loan market in the past few years. On a cumulative basis, downward price revisions have exceeded upward price flexes by 2.1:1 since January 2012. Underliers
How is Leveraged Lending Guidance changing lending dynamics? Register now for LPC’s 20th Annual Loan Conference on Sept. 18th New registrations use PROMO “LEADLEFT2014”.




Latest news

US leveraged loans returns turn negative in October
The Bloomberg US Leveraged Loan Index (Ticker: LOAN) has returned -0.26% this month through October 21, reducing its year-to-date return…

M&A activity begins to tick upward
In the third quarter of 2026, acquisition-linked loan volume across North America and Europe reached about $47 billion, up from $30.6 billion in Q2 and $29.5 billion a year ago.
