


Private Debt Intelligence – 7/30/2018

Private Debt Assets under Management Break New Records
Chart
Download Data
[wpdm_package id=’19456′]
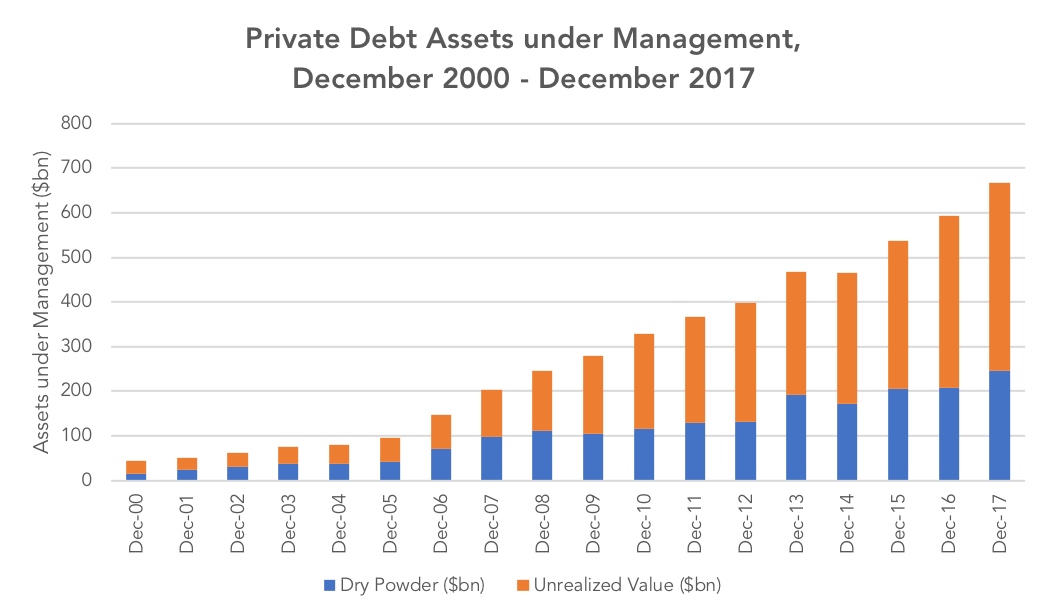
Preqin finds that private debt assets under management have risen for the third consecutive year, reaching a record $667bn at the end of 2017. This represents a 13% increase from December 2016 when private debt assets under management had yet to hit the $600bn mark. Private debt assets under management have in fact seen consistent year-on-year growth since December 2000, with the exception of 2014, when assets under management dropped by just $2.7bn from the year before. Not only have private debt assets under management seen consistent growth, but have more than tripled over the last decade. If this growth continues, and it looks like it will for at least the short-term future, the industry could very well see its asset under management hit the $1tn mark in a few short years.
With the exception of mezzanine funds, all other fund private debt fund types saw their assets under management increase from 2016 to 2017. Meanwhile, mezzanine funds saw their assets under management remain unchanged at $145bn from December 2016 to December 2017. Direct lending saw a notable increase of $47bn in assets under management, pushing their total assets under management to $203bn in December 2017. Special situations also saw a significant increase, with assets under management for the fund type rising by $20bn and stands at $95bn as at the end of 2017.
Distressed debt continued to represent the largest portion of the private debt industry pie in 2017. However, over the past four years, distressed debt has accounted for a decreasing proportion of total assets, falling from accounting for 37% of private debt assets in 2014 to 32% in 2017. By contrast, direct lending has seen the opposite trend: in 2014, the fund type accounted for 21% of total private debt assets, but accounted for 30% of assets under management in 2017.
Contact: Naomi Feliz
Naomi.Feliz@preqin.com



Latest news

European mid-market direct lending margins face steady compression since 2024
European mid-market direct lending margins have seen consistent compression over recent years but recorded a slight increase in the second quarter of 2026…

US leveraged loan issuance rebounds in September
Following three consecutive months of declining issuance, the US leveraged loan market has reversed course in September. Approximately $48.7b of…

Reversion to the Mean
Climbing toward the average is a very different story than surpassing it.