



For those of you who sensed last Friday was a special day, but couldn’t put your finger on why, we offer this explanation: On November 16, the annual General Conference on Weights and Measures in Paris voted unanimously to redefine the kilogram.
For decades metrologists have been in a tizzy since Le Grand K, the 19th century platinum/iridium cylinder that set the standard, was found to have fractionally depleted. The new standard is based on Planck’s constant, that relates electricity and weight.
But even this provides no perfect solution. “What we call ‘measurement’ is an estimate,” said one physicist. “The true value, only the universe knows.”
Our own search for true leverage loan value continues this week with a look at risk vs. return metrics. We know that spread per turn of leverage in the overall market has declined over the past several years (see our Chart of the Week). What’s not as clear is how that ratio measures up for first lien loans, particularly in the middle market.
According to S&P LCD stats, first lien debt-to-ebitda for middle market loans weighed in at 3.51x back in 2006. Today that leverage stands at 4.78x. LPC’s private credit numbers tell a similar story, though over a shorter period – 3.16x (2013) to 4.3x (through Sept 30).
Recall our Chart of the Week from the first instalment of this series that showed Moody’s comparison of first lien historic recoveries (77%) vs. a much lower projected (61%). With leverage having risen to current levels, this should be no surprise.
If first-lien recoveries were 77% when senior leverage was in the 3.0-3.5x range, what would you expect with leverage in the 4.25-4.75x range? Taking 77% of 3.25x, as a senior lender you would have recovered 2.50x of value.
Assuming 2.50x recovery on 4.50x leverage, gives you a 56% recovery. Pretty close to Moody’s estimate. Is the market pricing senior loans assuming 56% recoveries?
Then there are things like ebitda adjustments: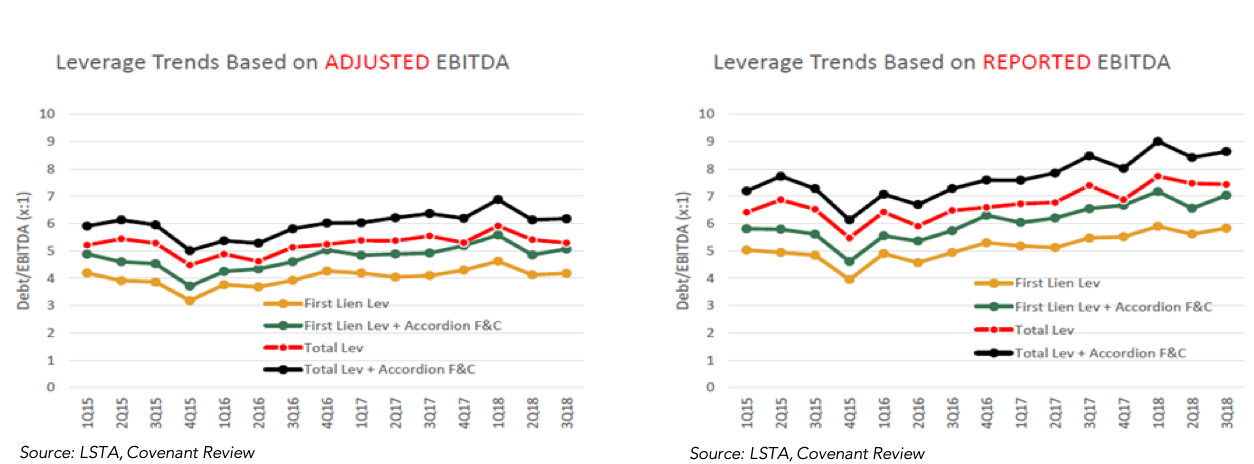
If add-backs and adjustments inflate leverage, what will that do to recoveries?



Latest news

US Leveraged Loans Return 3.36% to Investors YTD
The Bloomberg US Leveraged Loan Index (Ticker: LOAN) returned 0.96% in August and has gained an additional 0.28% through September…

PE dry powder
The capital that is being raised is flowing overwhelmingly to the largest, most established managers.

Middle market debt held by BDCs vs High yield vs Treasury yields
The blue line represents the current dividend yield of the VanEck BDC Income ETF (BIZD), which stood at 11.7% as…