



Download PitchBook’s Report here.
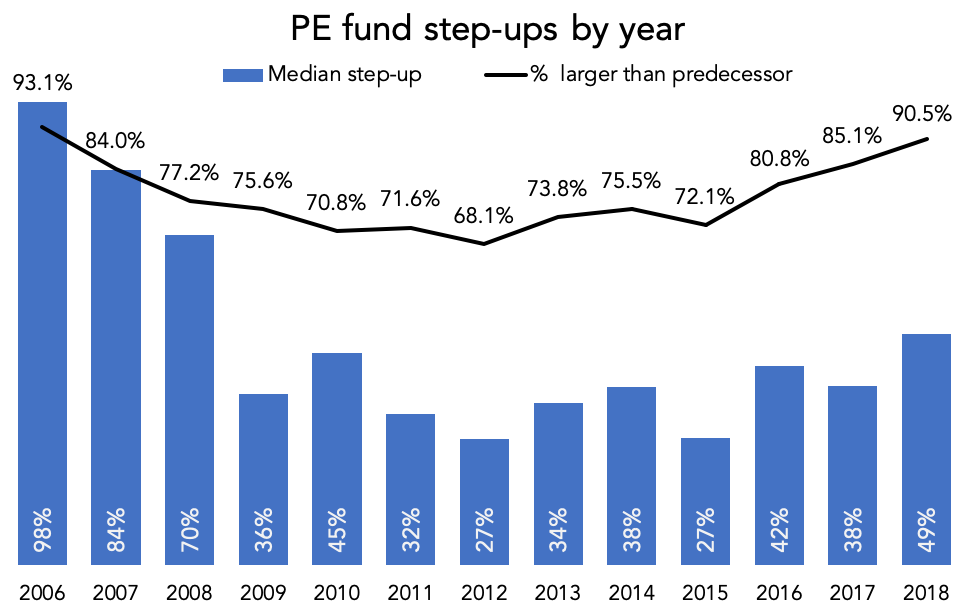
Over 90% of 2018 vintage PE funds were larger than their predecessors. That’s the first time in more than ten years that percentage has crept above 90%, the last being 2006.Opportunism is certainly at play, though its much more modest this time around. Back in 2006, the 93% of funds that were larger than their predecessors were also twice as big.The optimism of those days must have made for easy sleeping. Today’s successors are only 49% larger, which is broadly in-line with the step-ups seen since the crisis.
EY’s recent private equity survey lends credence to those numbers. 76% of their respondents said asset growth was their top strategic priority. Succession planning (24%) and technology initiatives (22%) were further down the list. For those planning on a new fundraise in 2019, 65% anticipated raising a larger fund than their last. EY’s respondents were top-heavy (16% had less than $1 billion under management, 19% had at least $20 billion), so we wouldn’t be surprised if the middle and lower middle markets were more bullish on asset growth. Based on historical trends, the 90% figure in the chart above doesn’t have much room to go higher. It should flatline or dip this year, especially if the fundraising boom starts losing its oomph.
It may have lost a little already—fundraising volume and value fell 26% and 22% YoY, respectively. EY’s survey focuses heavily on margin erosion and cost management, and a growing number of firms appear to be laying the groundwork for leaner operations going forward. “This environment [referencing fee pressures and higher expenses] is straining the economics of almost every manager,” with 40% reporting margin compression over the past two years. At least 25% of respondents have reduced headcounts, renegotiated vendor fees or increased their use of outsourced service providers to stay any margin slips. 18% have reduced travel and entertainment budgets, the most dreaded cut of the bunch. All against the backdrop of larger and larger funds.


Latest news

Share of PE middle-market deal count by backing type
Add-ons remain the workhorse for middle-market deployment, accounting for 67. 1% of all middle-market transactions YTD, in line with activity seen in recent years.

Software deal share falls in middle markets, rises in large caps
In Q3’26 software’s share of total deals fell in both the Lower Middle Market (to 7%) and Upper Middle Market (to 9%), while Large Cap saw a modest uptick in share to 8%.

Secondary loan prices stabilize following steep declines
Secondary loan prices came under significant pressure through September and October, with the Bloomberg U.S. Leveraged Loan Index declining 119…