



Download PitchBook’s Report here.
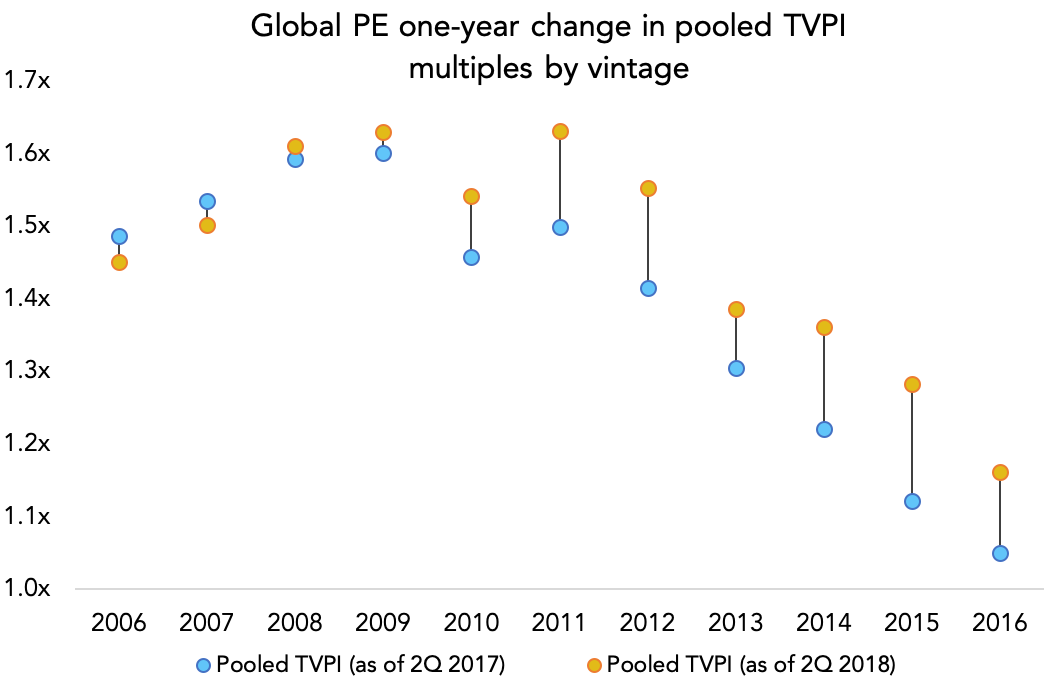
TVPI multiples—more simply known as investment multiples—remain healthy. Gains from post-vintage buckets (2010-2016) were all boosted by at least 0.08x over the past twelve months, with 2015 vintages leading the way with an overall boost of 0.16x. Looking further back, TVPIs declined in 2006 and 2007 vintages, likely due to selling crisis-era investments at valuations below carrying value.
The broader takeaway from recent performance metrics is a mixed bag. On the one hand, returns are consistently in positive territory. The industry came out of the financial crisis intact, thanks in large part to creative, and lenient, contributions from lenders and from the Fed itself. It would have been hard to believe ten years ago that not only would PE recover from the crisis, but that LPs would push their PE allocations as high as they have today. Respondents to our 2018 Annual Institutional Investors Survey indicated an average allocation bump of 30.9% to 32.5% for private market strategies. Only eternal optimists would have seen that coming, and there aren’t very many of those types in finance. Those allocation increases are only going to expand the size of the PE industry, which has enough competition as it is. While positive, the TVPI gains graphed above aren’t what they used to be, and expectations have become much more subdued as a result. PE used to handily beat the public markets, but today’s PMEs (or public market equivalents) have declined significantly since the early 2000s. But to survive the financial crisis and continue generating returns is a testament to PE’s durability. With more money and competition heading its way, return expectations will remain modest. Investors have historically had little trouble beating modest expectations, which appears to be the case again.
Contact: Alex Lykken
alex.lykken@pitchbook.com


Latest news

Share of PE middle-market deal count by backing type
Add-ons remain the workhorse for middle-market deployment, accounting for 67. 1% of all middle-market transactions YTD, in line with activity seen in recent years.

Software deal share falls in middle markets, rises in large caps
In Q3’26 software’s share of total deals fell in both the Lower Middle Market (to 7%) and Upper Middle Market (to 9%), while Large Cap saw a modest uptick in share to 8%.

Secondary loan prices stabilize following steep declines
Secondary loan prices came under significant pressure through September and October, with the Bloomberg U.S. Leveraged Loan Index declining 119…