


Private Debt Intelligence – 7/29/2019

Private Debt Dry Powder Falls in Q2
Chart
Download Data
[wpdm_package id=’26914′]
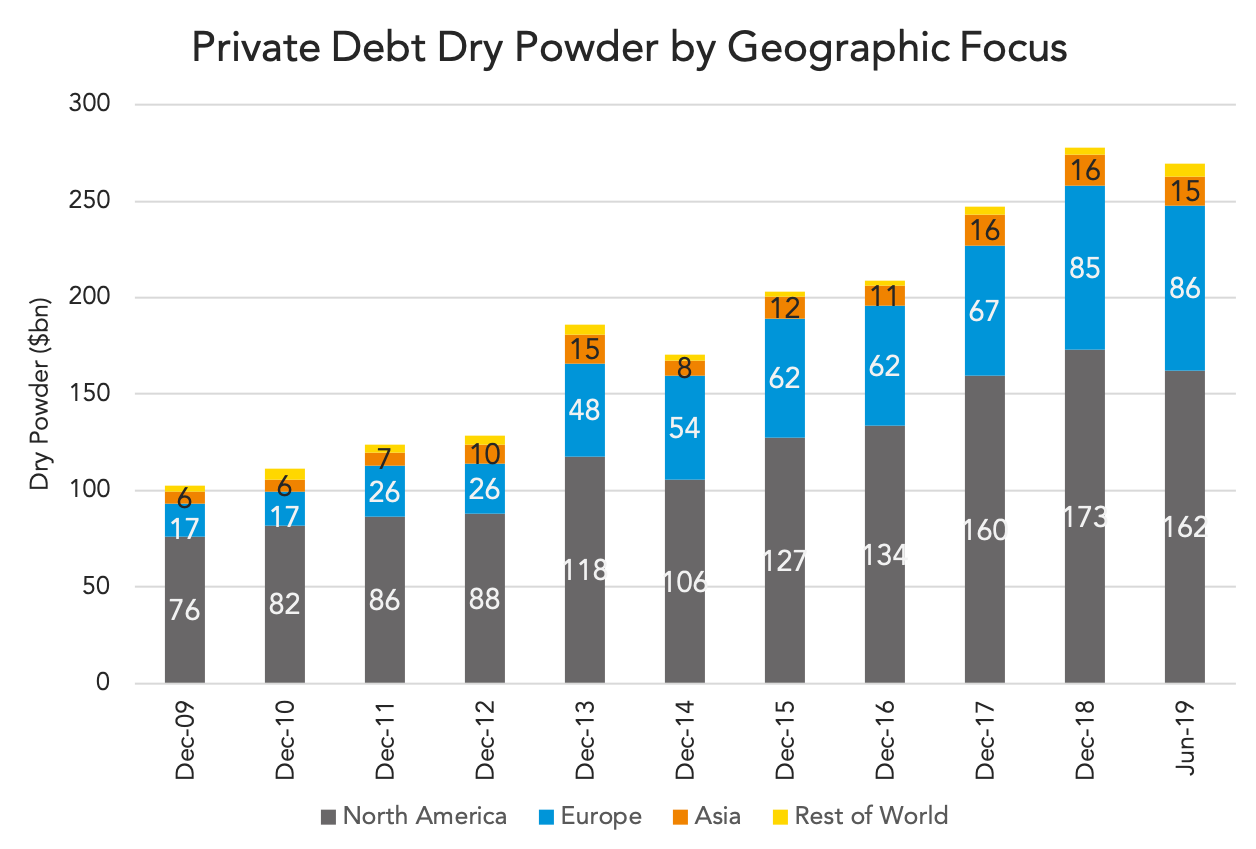
The available capital held by private debt fund managers fell in Q2, reflecting the slower pace of fundraising. Having grown from $278bn at the end of 2018 to $286bn at the end of Q1, dry powder fell to $269bn in the three months to the end of June. This marked the first such decrease since 2014.
The fall in dry powder was primarily due to North America-focused funds, which saw their available capital fall from $173bn to $162bn. This may, in fact, be a positive sign – fundraising was lackluster across all regions, and a fall in dry powder indicates that fund managers focused on the region were still able to put capital to work. Asia-focused funds saw a small fall, while dry powder levels in Europe rose slightly from $85bn to $86bn.
While focused on a single region, the fall in dry powder was spread across all major fund types. Direct lending funds continue to account for the largest proportion of available capital, but totals fell from $106bn at the end of 2018 to $103bn as of the end of June. Distressed debt and mezzanine funds saw larger decreases, falling from $71bn to $67bn and $58bn to $55bn respectively. Again, this is likely a reflection of slower fundraising – distressed debt funds in particular have seen much lower fundraising in the first half of 2019 than in previous years, but fund managers continue to identify and invest in deal opportunities.
Given that dry powder has doubled since the end of 2012, a decrease may bode well for the industry. Less money available to fund managers may reduce pricing pressure and competition for attractive deals, in turn boosting future performance prospects. Additionally, many investors might be waiting for fund managers to deploy some of their available capital before making further commitments. If so, a further fall in dry powder in Q3 may boost fundraising going into 2020.
Contact: William Clarke
william.clarke@preqin.com




Latest news

US leveraged loans returns turn negative in October
The Bloomberg US Leveraged Loan Index (Ticker: LOAN) has returned -0.26% this month through October 21, reducing its year-to-date return…

M&A activity begins to tick upward
In the third quarter of 2026, acquisition-linked loan volume across North America and Europe reached about $47 billion, up from $30.6 billion in Q2 and $29.5 billion a year ago.
