



Download PitchBook’s Report here.
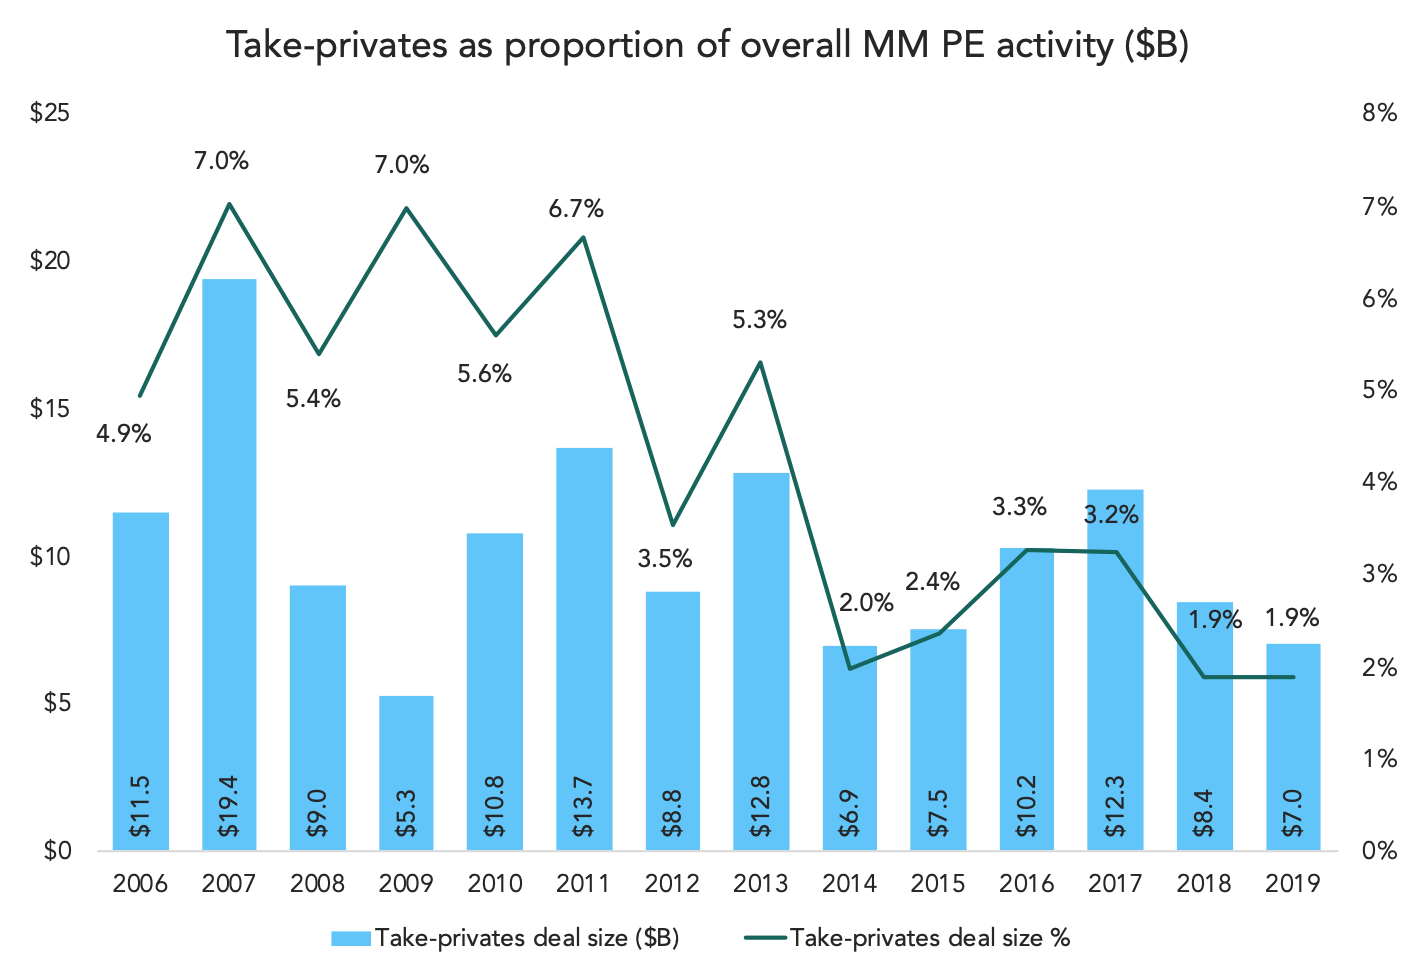
Middle market investors aren’t known for prolific take-private activity, but the percentages are surprisingly low. For the past two years, middle-market take-privates have accounted for less than 2% of all middle market activity. 2% is pretty skimpy. Dating back to 2014, MM buyouts have been responsible for about 2-3% of all MM activity. Further back, though, take-privates used to be more prominent in terms of deal sourcing. In 2007, for example, at the height of the buyout boom, they accounted for 7% of all MM deals. The 2006-2011 timeframe was consistently in the 5-7% window.
These aren’t huge percentages, but the sudden change in prominence, and the consistency of the smaller percentages going back to 2014, suggest that middle-market investors aren’t looking at public companies as much as they used to. The middle market as a whole saw almost $450 billion worth of activity last year. In 2011, when take-privates accounted for almost 7% of all MM buyouts, combined deal value across the entire middle market had eclipsed $200 billion for the first time. One possible explanation for today’s lower ratio: the middle market is that much bigger, with that many more new investors targeting more and more niches, that the public markets have become a relative afterthought to today’s investors, especially the newcomers.


Latest news

Share of PE middle-market deal count by backing type
Add-ons remain the workhorse for middle-market deployment, accounting for 67. 1% of all middle-market transactions YTD, in line with activity seen in recent years.

Software deal share falls in middle markets, rises in large caps
In Q3’26 software’s share of total deals fell in both the Lower Middle Market (to 7%) and Upper Middle Market (to 9%), while Large Cap saw a modest uptick in share to 8%.

Secondary loan prices stabilize following steep declines
Secondary loan prices came under significant pressure through September and October, with the Bloomberg U.S. Leveraged Loan Index declining 119…