



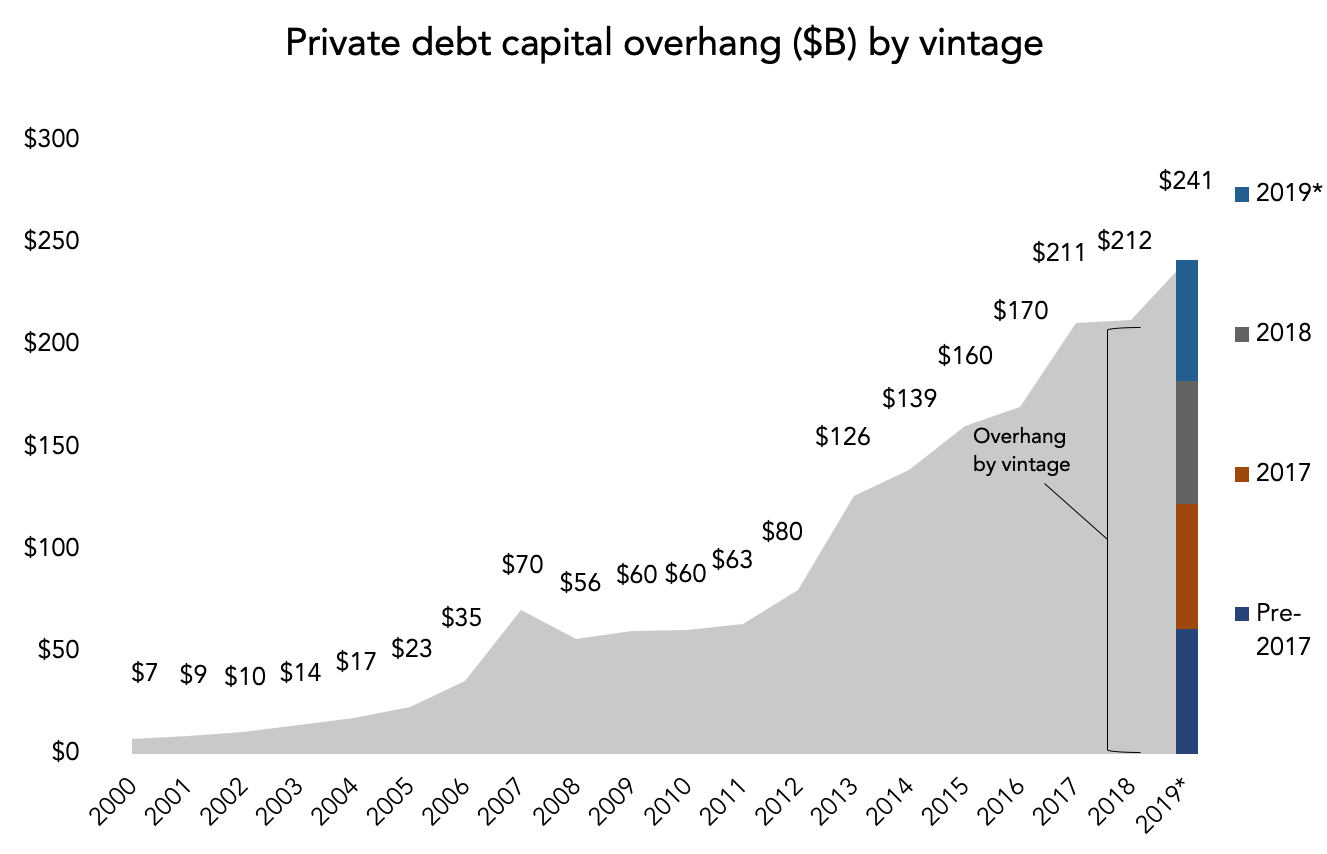
The boom in direct debt lending has directly coincided with the PE boom over the last decade. No surprise there—a decade ago was the global financial crisis and its aftermath, when traditional lines of credit from Wall Street suddenly dried up. Direct lenders, with fewer regulatory burdens, swooped in and never left. Today direct lending accounts for over half of all private debt fundraising, according to PitchBook’s upcoming Global Private Debt Report (releasing this Monday). As a sub-strategy, direct lending funds raised $71.6 billion in 2019, amounting to 57% of all private debt fundraising. A record sum, the $71.6 billion figure was raised by only 32 funds, the lowest fund count since 2012. Average fund sizes have grown much larger over the last three years—all told, $185.7 billion has been raised by direct lenders since 2017, and annual fund counts have gone down each year, as well.
Some direct lenders depend entirely on PE sponsors for deal flow. That spurred concerns that lenders would be too lenient on deal opportunities, with bad deals being financed to avoid burning bridges with PEGs and future lending opportunities. A surplus of dry powder is a separate concern—private debt as an asset class reached $241 billion of dry powder last year, a figure that will likely keep increasing as time goes on. But when we divide today’s dry powder levels by the three-year rolling average of capital calls to private debt funds, those concerns don’t look as dire. In fact, at today’s lending pace, private debt funds have a modest 2.4 years worth of dry powder on hand, with similar numbers dating back to 2013. Managers as a whole don’t appear to be struggling to put capital to work. They at least don’t look as desperate as some suspect.


Latest news

Share of PE middle-market deal count by backing type
Add-ons remain the workhorse for middle-market deployment, accounting for 67. 1% of all middle-market transactions YTD, in line with activity seen in recent years.

Software deal share falls in middle markets, rises in large caps
In Q3’26 software’s share of total deals fell in both the Lower Middle Market (to 7%) and Upper Middle Market (to 9%), while Large Cap saw a modest uptick in share to 8%.

Secondary loan prices stabilize following steep declines
Secondary loan prices came under significant pressure through September and October, with the Bloomberg U.S. Leveraged Loan Index declining 119…