



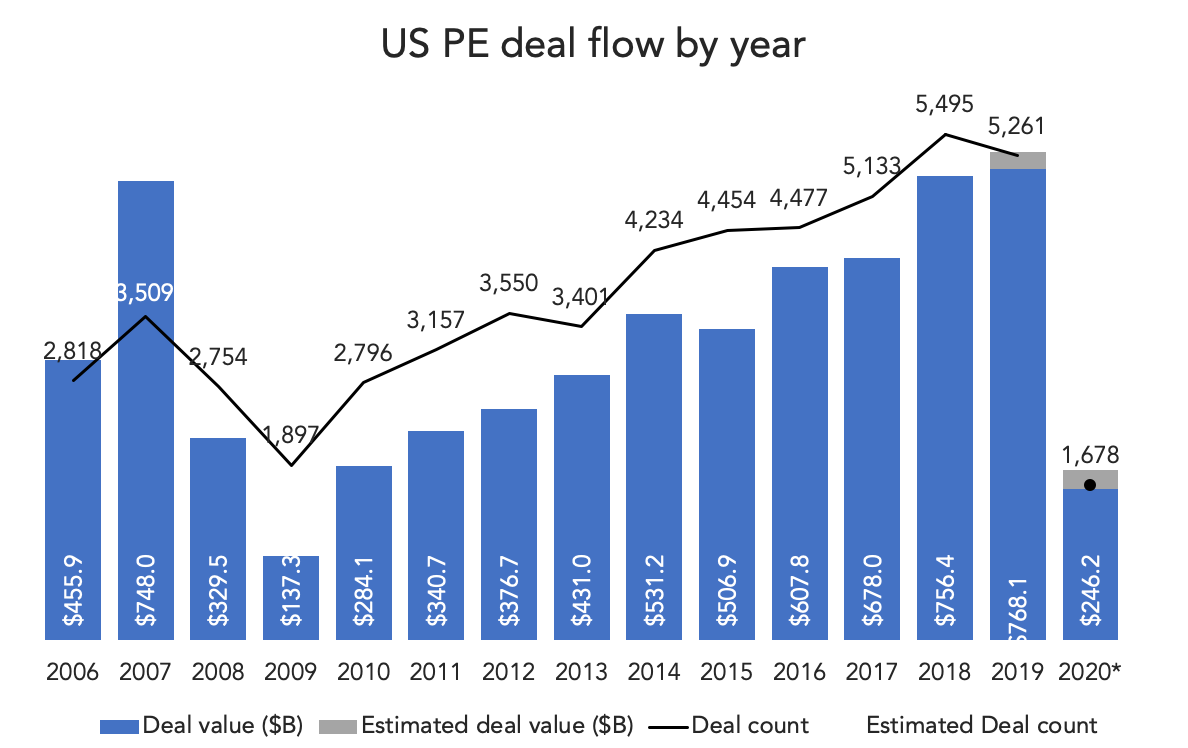
PitchBook’s latest US PE Breakdown is out this Friday, and newsletter subscribers will have access to it that morning. The first full quarter of COVID-impacted data is in and it isn’t pretty. Overall US PE deal flow was down 54% from the first quarter, from 1,147 transactions to only 531. Q1 was itself partially impacted by the lockdowns, so the YoY comparison with Q2’19 (down 61%) carries some weight. On a value basis, the $94.3 billion invested marked a 40% drop from Q1’20 and a 58% drop from Q2’19. It’s also the first sub-$100B quarter since Q2’13. For perspective, the average quarterly total between Q3’18 and Q4’19 was $198.7 billion. All said and done, both value and volume were effectively cut in half.
It’s worth noting the above figures included add-ons and minority transactions. Platform buyouts fared much worse. There were only 118 of them in Q2, which included several that were signed pre-COVID and couldn’t be canceled. The QoQ drop was 57% (276 in Q1’20) while the YoY drop was a whopping 69% (378 in Q2’19). Secondary buyouts are falling precipitously, not only by raw count but also compared to other types of transactions. Only 75 have been made the first six months of the year, a far cry from the 335 done last year. More interestingly, SBOs made up only 19.5% of all H1 PE transactions, the first reading below 20% since the financial crisis. They normally account for about 25% of all volume.
Add-ons, meanwhile, have shown signs of strength, but Q2 volume was still down quite a bit. The 300 add-ons completed last quarter were less than half of Q1 volume (658) and 60% beneath Q2’19 (738). Nevertheless, the complete halt in platform buyouts boosted the add-on/LBO ratio to 72%, the highest we’ve ever published. What’s more, growth/minority transactions were historically strong, at least relative to buyouts. 113 minority deals were completed, only five fewer than the 118 platform buyouts mentioned earlier. It’s not uncommon to see a 2:1 ratio in any given quarter—to our knowledge, we’ve never seen those statistics so close before. Minority deals almost outnumbered buyouts for the first time ever.
As bad as the second quarter was, the 531 number was higher than any quarter in 2009. Today’s PE industry isn’t apples-to-apples comparable to the 2009 version, since it’s become much bigger over the last decade. It’s still a little encouraging to see that Q2, as bad as it was, didn’t reach 2009 depths. Much more is in the report, available for free this Friday morning.


Latest news

Share of PE middle-market deal count by backing type
Add-ons remain the workhorse for middle-market deployment, accounting for 67. 1% of all middle-market transactions YTD, in line with activity seen in recent years.

Software deal share falls in middle markets, rises in large caps
In Q3’26 software’s share of total deals fell in both the Lower Middle Market (to 7%) and Upper Middle Market (to 9%), while Large Cap saw a modest uptick in share to 8%.

Secondary loan prices stabilize following steep declines
Secondary loan prices came under significant pressure through September and October, with the Bloomberg U.S. Leveraged Loan Index declining 119…