



Download PitchBook’s Report here.
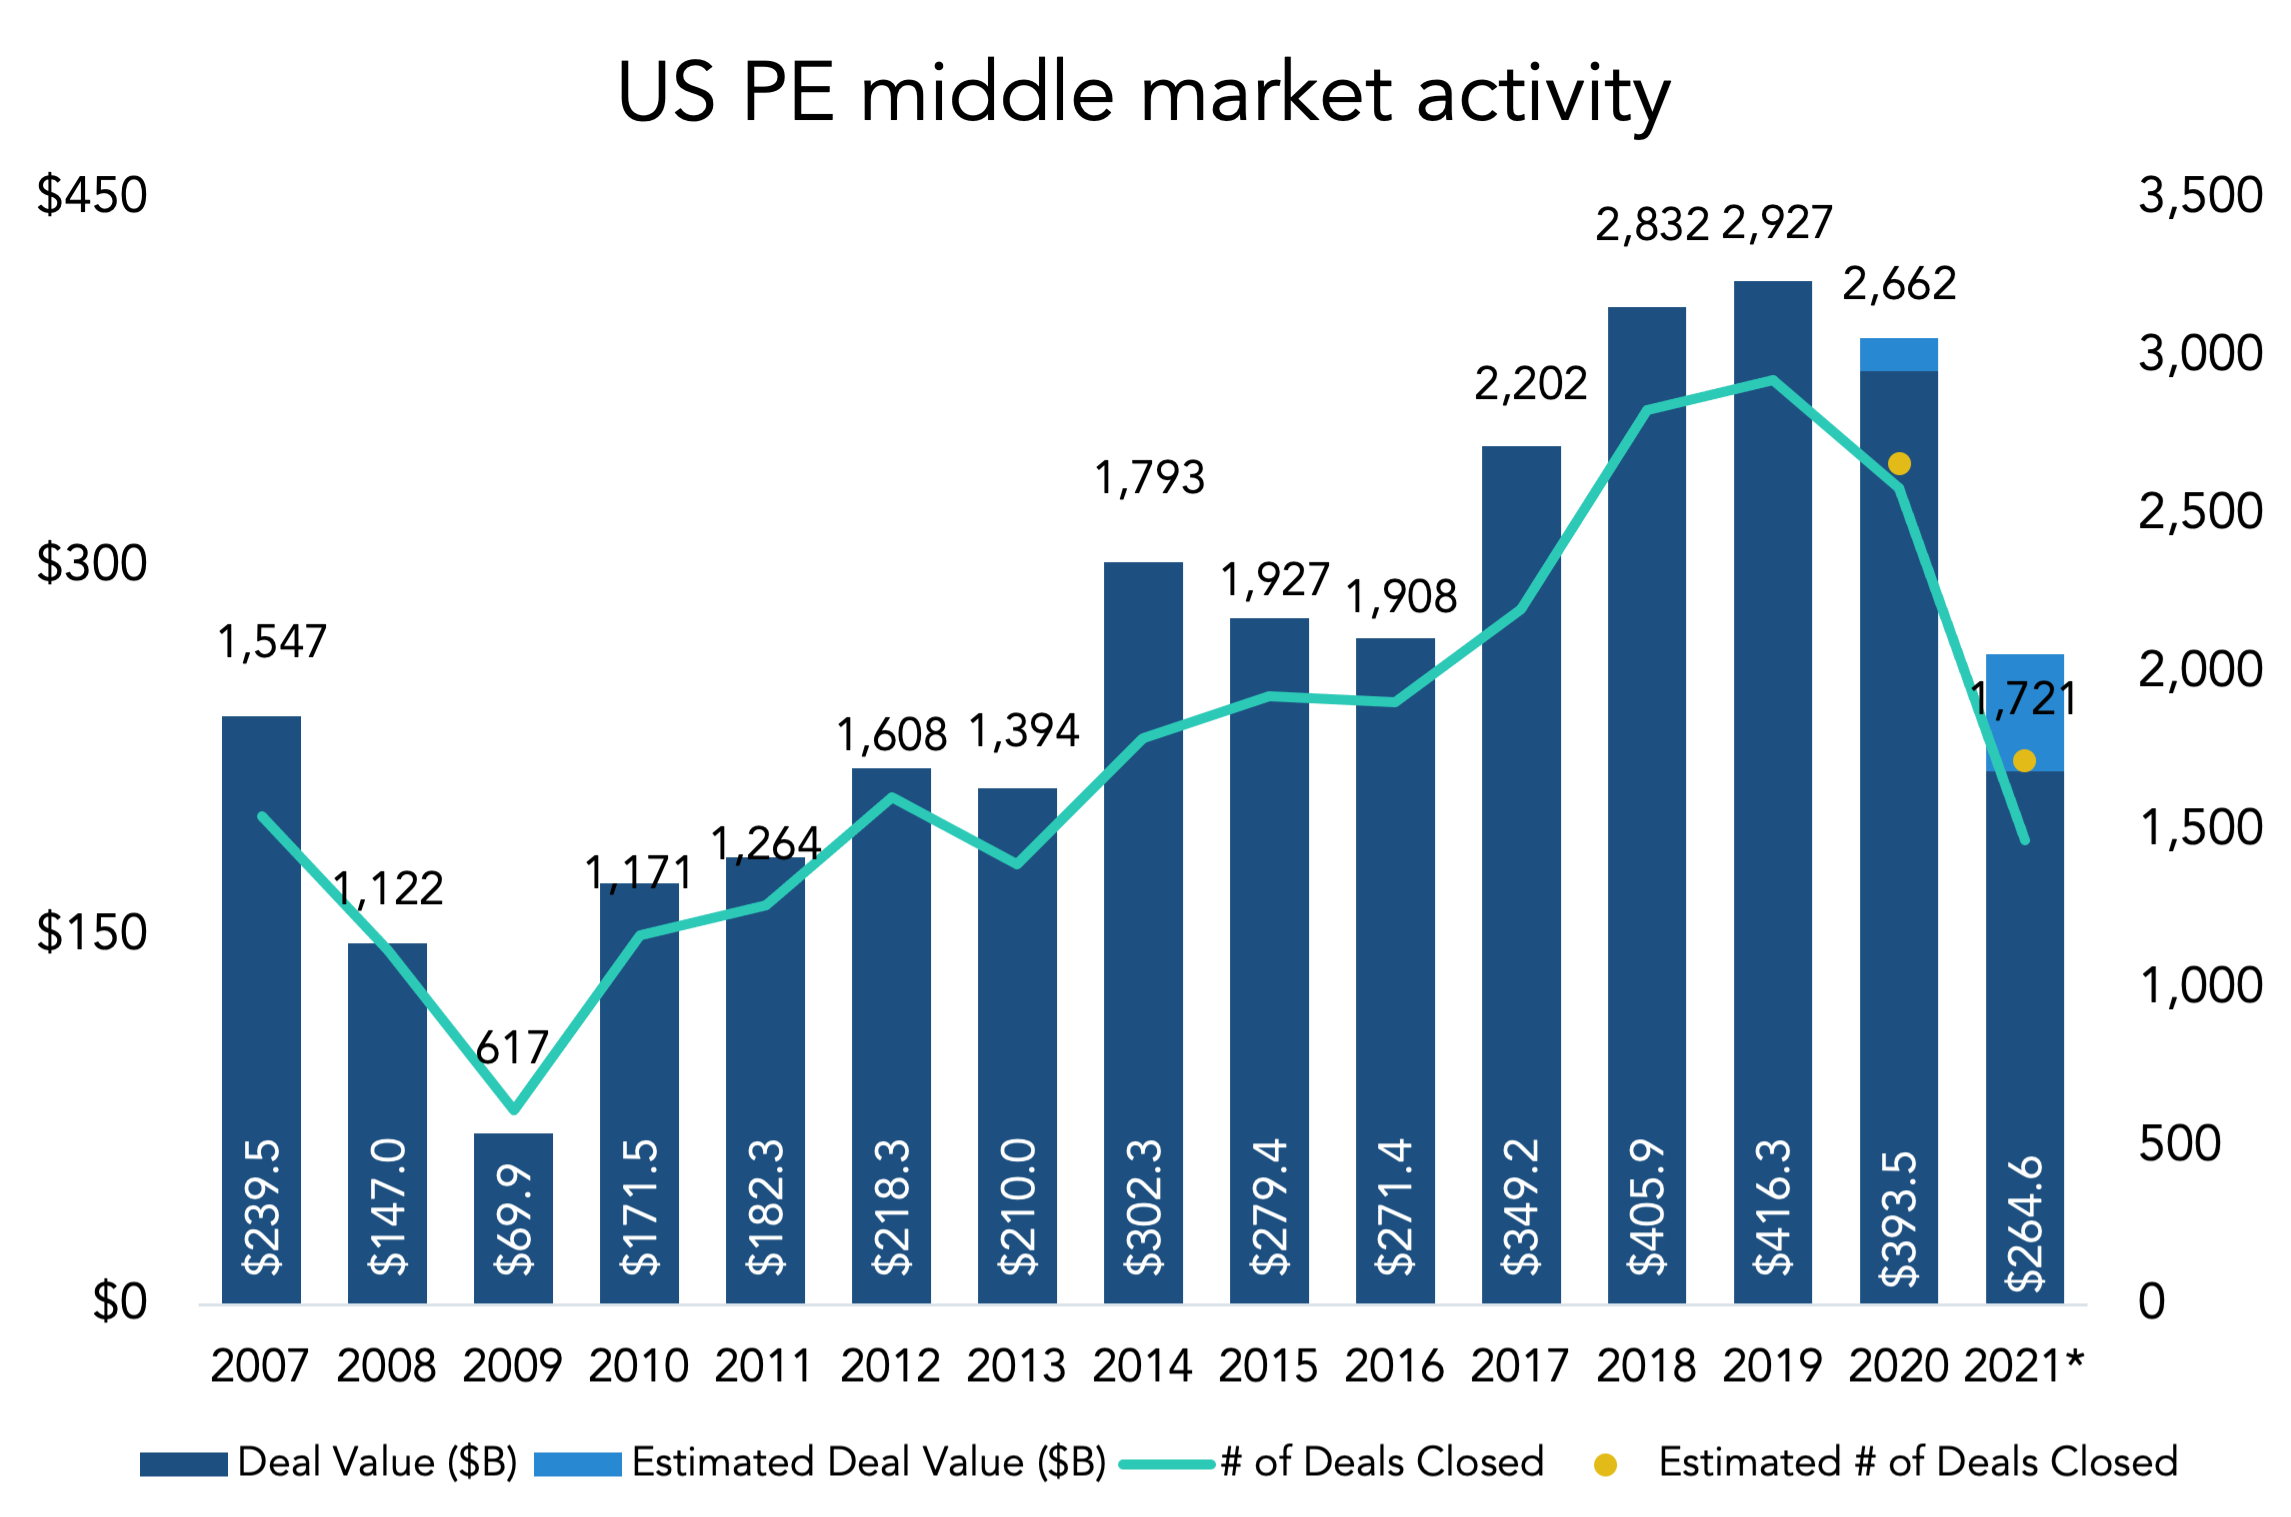
PitchBook’s latest US Middle Market Report was released today. The frenetic pace of dealmaking continued into the second quarter, reaching an estimated $142.8 billion. That would mark the second highest quarterly total on record, behind Q4 2020’s $156.8 billion. Sandwiched between those two was a $121.7 billion performance in Q1 2021, now the third highest on record. Taken together, the past three quarters have combined for $421.3 billion worth of transactions, more than any one year in the middle market’s history.
The first half saw about $264.6 worth of activity. That’s easily on pace for record territory, and back halves of the year typically outweigh the front halves. We anticipate more of the same to close out the year, with anecdotal reports of bankers hiring extra analysts to handle their backlogs. There’s also the question of possible changes to the capital gains tax rate, which would push sell-side owners to close deals ahead of 2022.
Macro headwinds remain. Severe labor shortages are showing up in manufacturing and healthcare, two mainstays for PE managers. Some employers are even offering signing bonuses for low-wage positions. That’s a topic of discussion among investors and a hamstring for portfolio company operations. So is inflation: Apollo CEO Marc Rowan told CNBC this week that “everything that we once did now costs more,” and “our experience in our portfolio is really no different than the broader economy.” The middle market isn’t immune to those pressures, despite the breakneck pace of dealmaking that is set to continue over the next two quarters.
(Past performance is no guarantee of future results.)




Latest news

US Leveraged Loan Launches Exceed $30b in post-Labor Day Rush
The US leveraged loan market recorded $24.6b of new launches on Tuesday, September 8, marking the busiest post-Labor Day surge…


PE fund distribution rates
Following 2021, buyout distribution rates have fallen to roughly 10% to 15% below the 25-year average.