



Download PitchBook’s Report here.
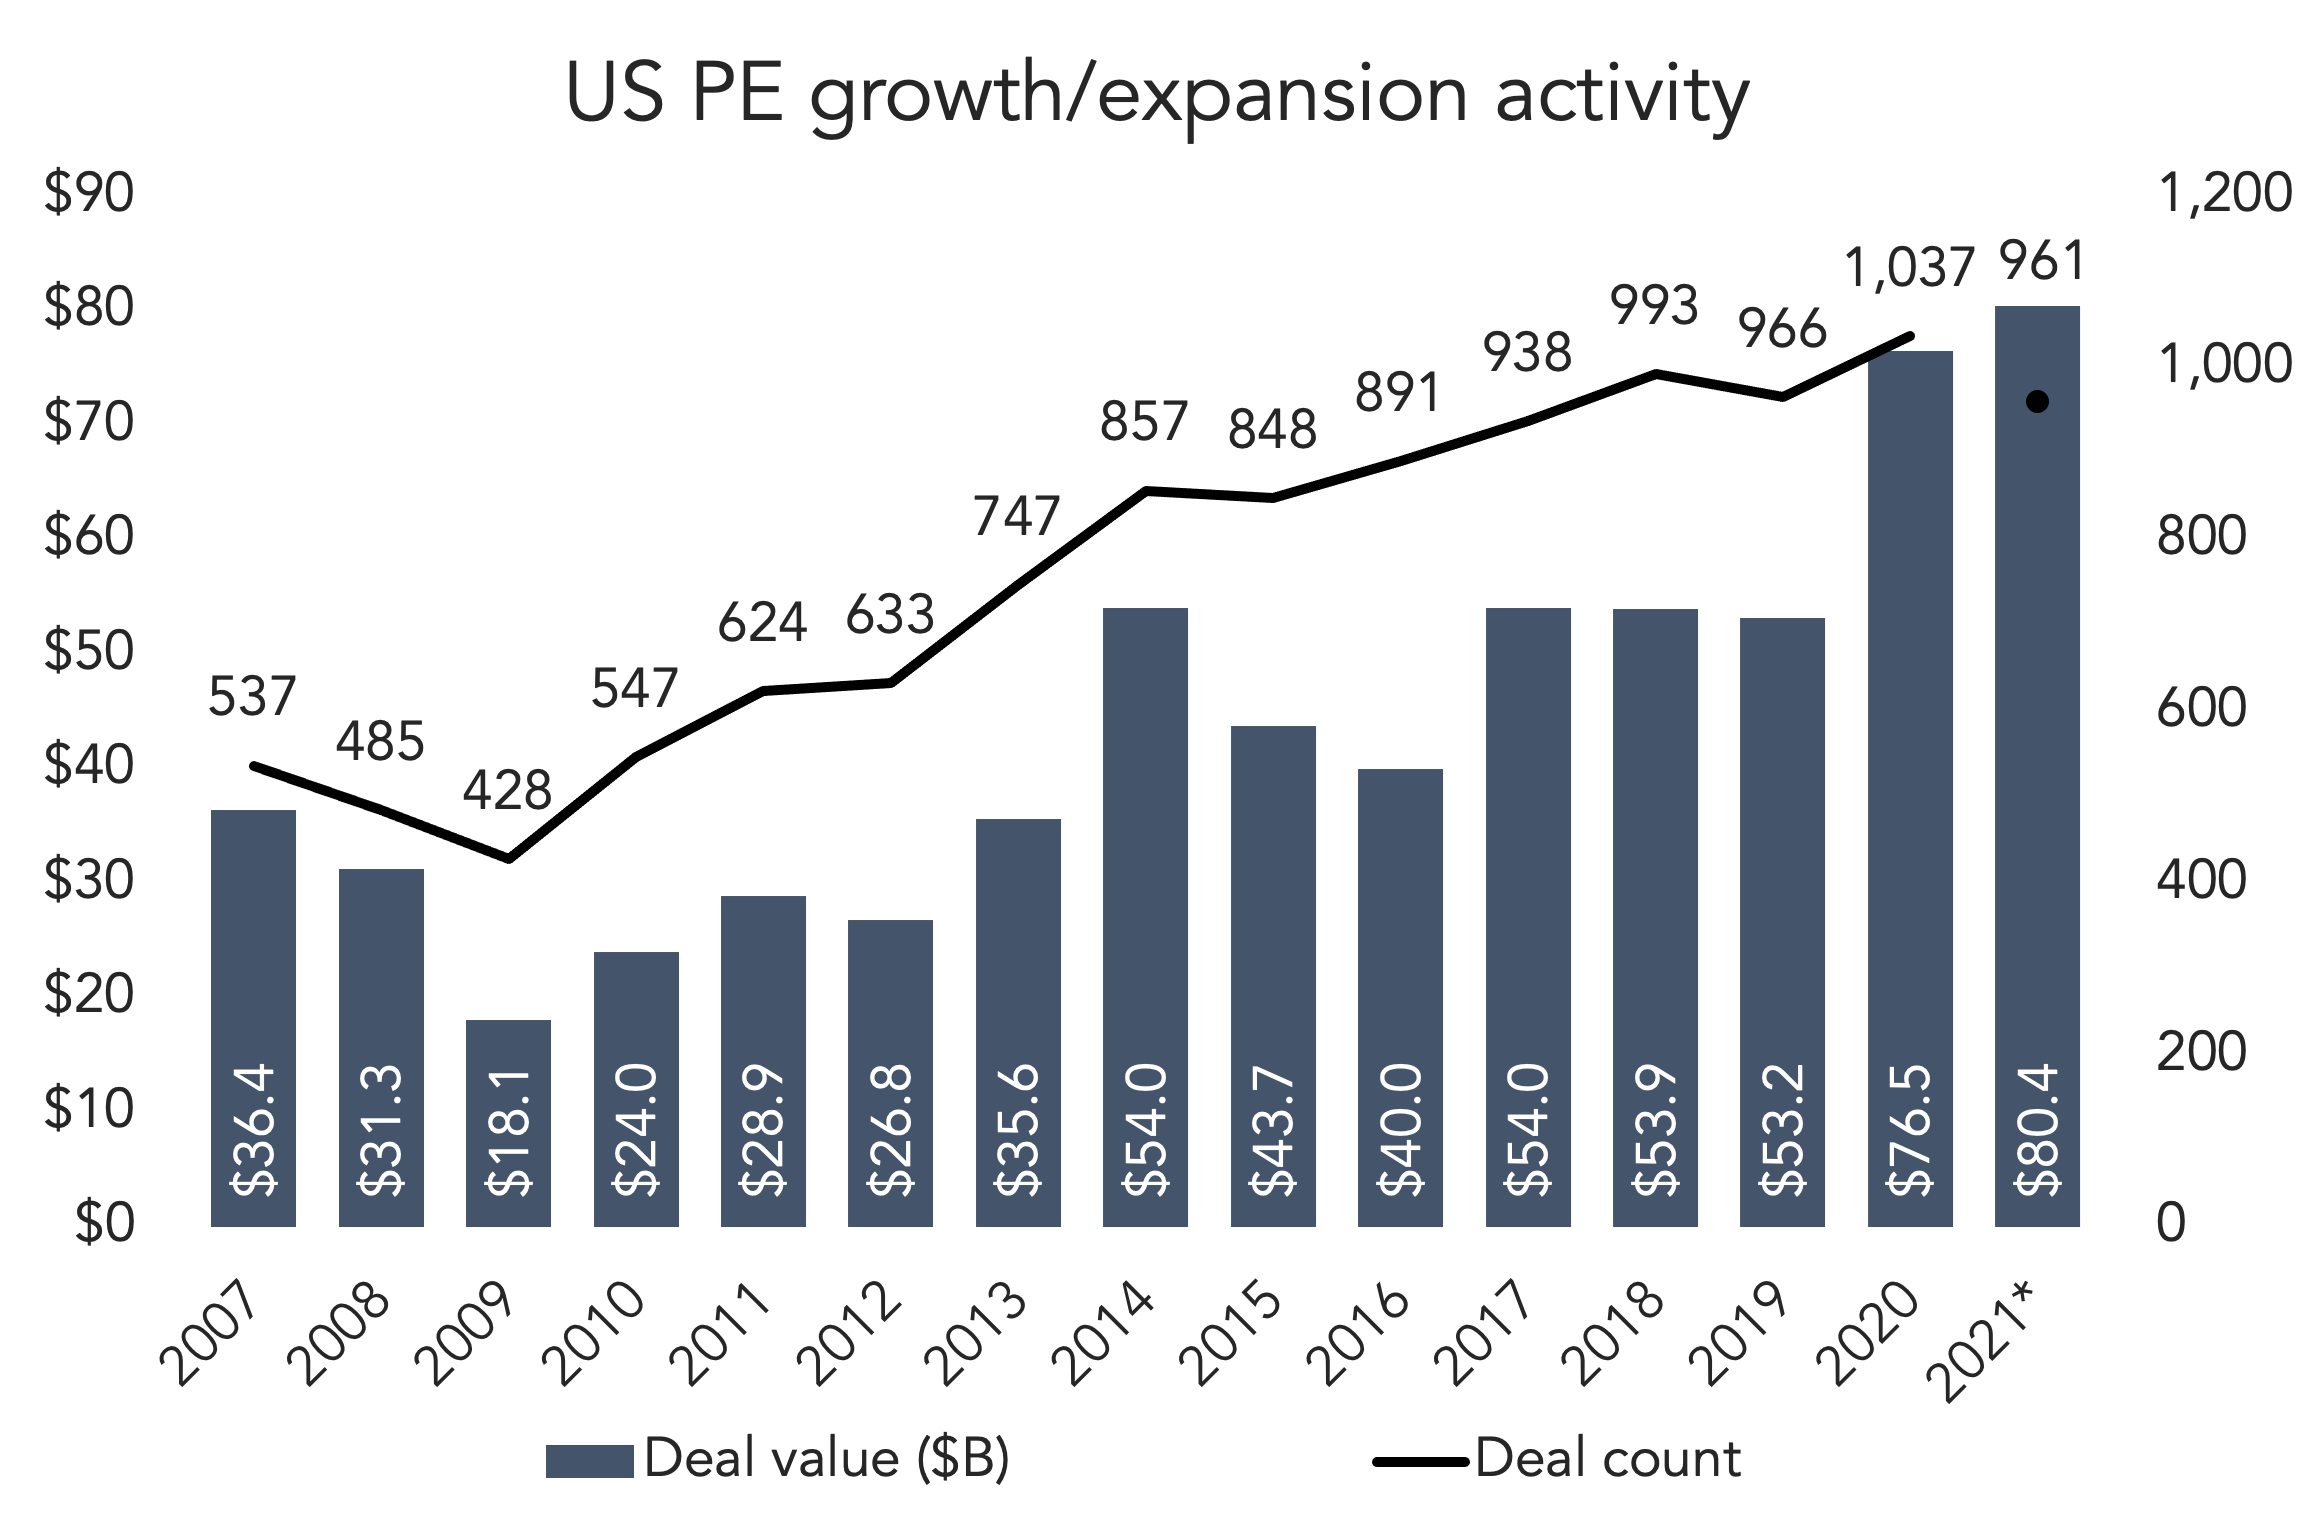
One sea change in the post-COVID PE market is the surge in growth deals. According to PitchBook’s latest US Breakdown Report, both 2020 and YTD 2021 have exceeded the $75 billion line, and 2021 is the first year we’ve gone past $80 billion. We’re on pace to see north of $100 billion in minority stake transactions this year, which would be much larger than anything we saw pre-COVID. Growth deals are also making strides compared to buyouts. When we filter out add-ons and directly compare minority/majority stake transactions, it’s almost 50/50. 1,031 LBOs have closed this year, not far ahead of the 961 growth deals recorded through Q3. That’s a breakdown of 52/48 between the two. In 2019, before the migration to growth deals began, the breakdown was 61/39. During the buyout boom in 2007, it was 73/27.
Market dynamics helped propel that trend last year. Not all business owners wanted to sell control of their companies because of a black swan event, especially if they had been performing well before 2020. Non-control stakes were a different story, and PE firms gave those businesses sturdy equity cushions to ride out the storm. At the same time, PE firms became bullish on tech-focused, late-stage venture rounds, blurring the lines between growth equity deals and venture financing. It’s a trend worth watching even as the pandemic passes—late-stage “growth” rounds can be a good fit for PE, aligning with their standardized holding periods, underwriting capabilities and risk/reward expectations.
(Past performance is no guarantee of future results.)


Latest news

Share of PE middle-market deal count by backing type
Add-ons remain the workhorse for middle-market deployment, accounting for 67. 1% of all middle-market transactions YTD, in line with activity seen in recent years.

Software deal share falls in middle markets, rises in large caps
In Q3’26 software’s share of total deals fell in both the Lower Middle Market (to 7%) and Upper Middle Market (to 9%), while Large Cap saw a modest uptick in share to 8%.

Secondary loan prices stabilize following steep declines
Secondary loan prices came under significant pressure through September and October, with the Bloomberg U.S. Leveraged Loan Index declining 119…