



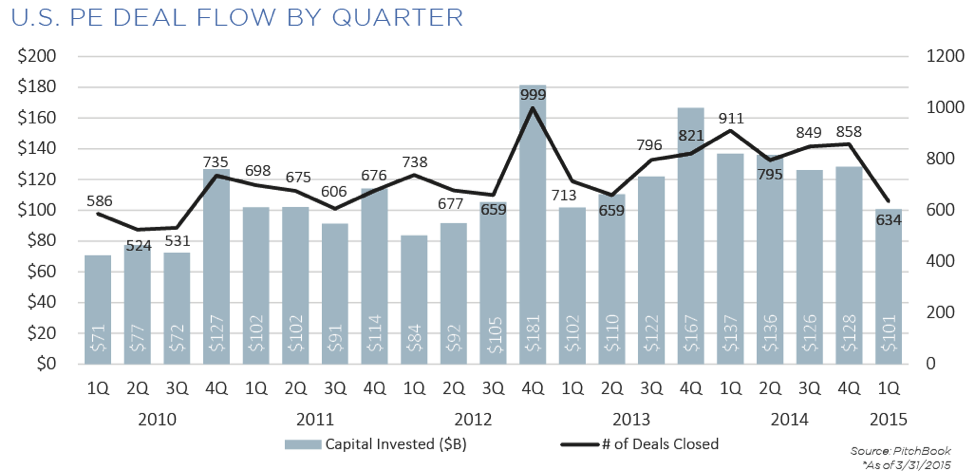
We expected to see a strong start this year for PE deal flow in the U.S. What we found was pretty subdued, especially considering the relatively soft fourth quarter that closed out 2014. Typically, fourth quarter numbers are artificially high, due to impending tax changes or a number of other reasons. So it was a bit surprising to see such a steep drop-off in both counts and value in 1Q 2015, down 26% and 22%, respectively, from 4Q 2014 and 30% and 26% from 1Q 2014 levels.
To download PitchBook’s 1Q 2015 Global PE Deal Multiples & Trends Report, please click here.



Latest news

Share of PE middle-market deal count by backing type
Add-ons remain the workhorse for middle-market deployment, accounting for 67. 1% of all middle-market transactions YTD, in line with activity seen in recent years.

Software deal share falls in middle markets, rises in large caps
In Q3’26 software’s share of total deals fell in both the Lower Middle Market (to 7%) and Upper Middle Market (to 9%), while Large Cap saw a modest uptick in share to 8%.

Secondary loan prices stabilize following steep declines
Secondary loan prices came under significant pressure through September and October, with the Bloomberg U.S. Leveraged Loan Index declining 119…