



Download PitchBook’s Report here.
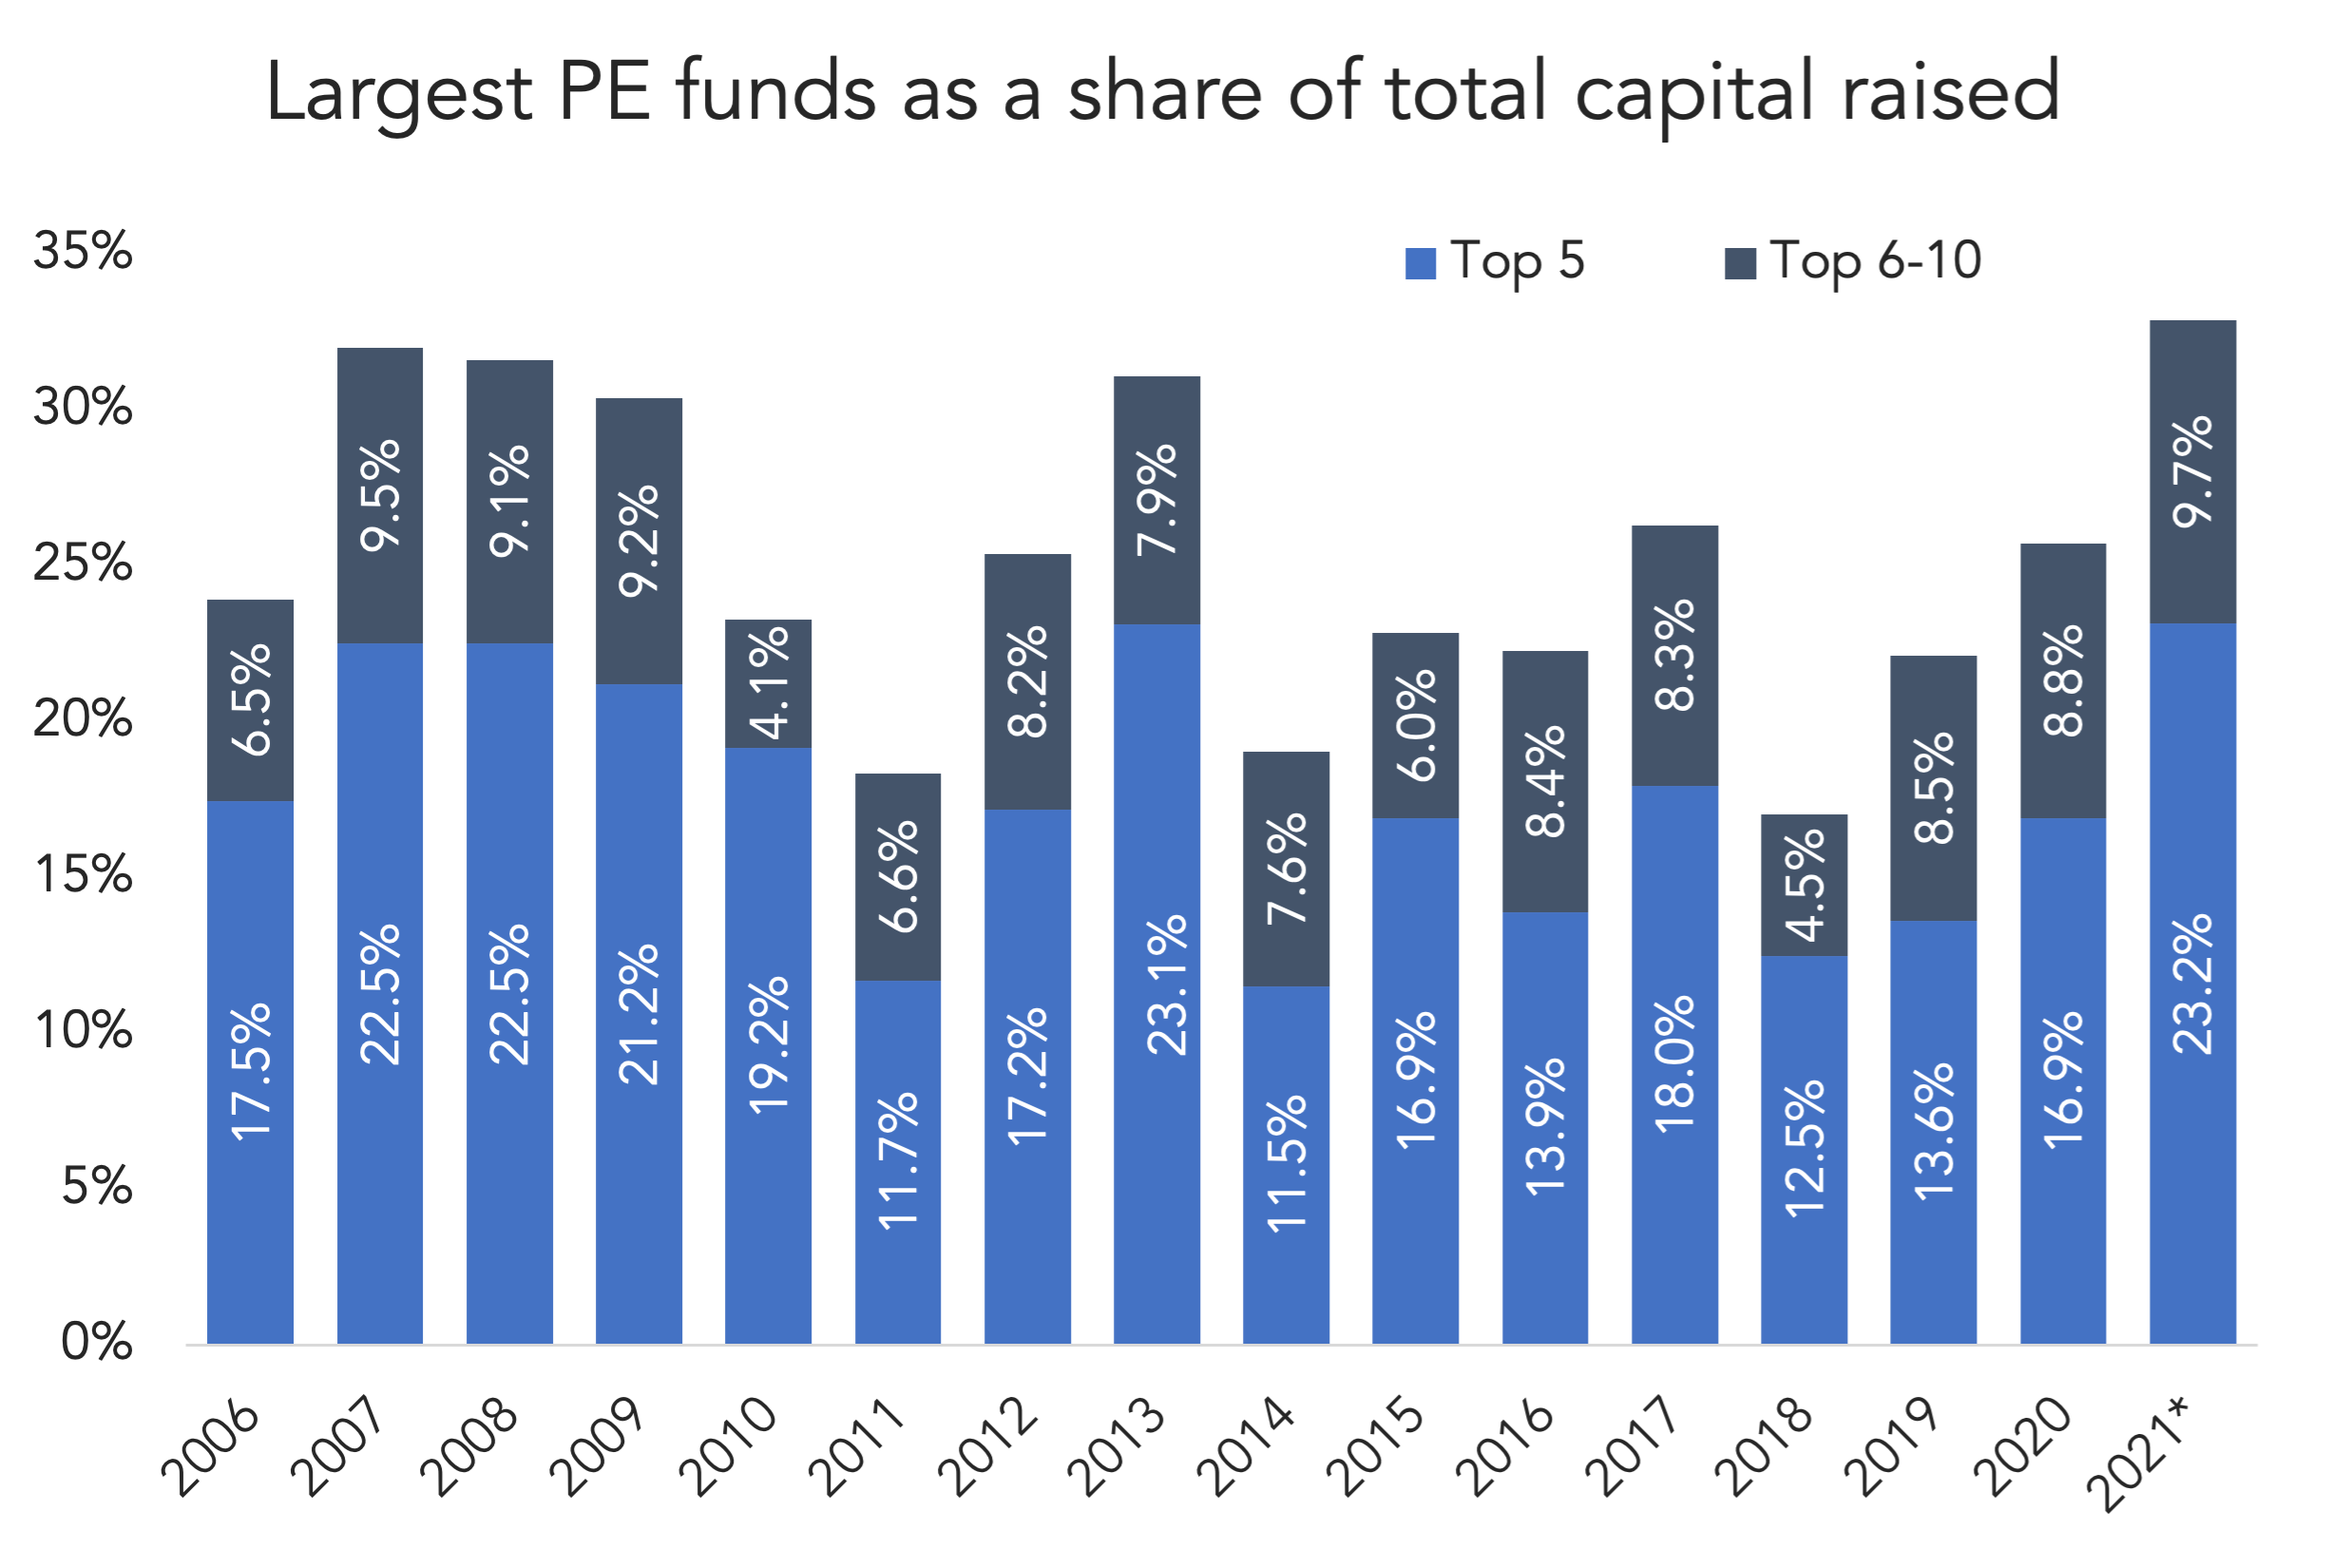
Last week we highlighted PitchBook’s new Quantitative Perspectives report, US PE: Recovery and Beyond, which features a number of vivid findings that are worth checking out. The chart above highlights how much oxygen is taken up by the biggest PE funds in the United States. In 2021, for example, the five biggest PE funds that closed this year account for 23.2% of all capital raised. That’s the highest ratio seen in at least two decades, higher even than the buyout boom. When the data is stretched to the 10 biggest funds, 2021 also comes out on top at 32.9%. In other words, the 10 biggest funds raised this year account for almost a third of all capital raised.
Separately, PitchBook released its latest US PE Middle Market Report yesterday. Middle-market fundraising has slowed since COVID, which has brought the middle market’s share of dollars raised below 50% through the third quarter. That hasn’t happened since 2017, which was an outlier year. Otherwise, middle market fundraising has accounted for at least 50% of all dollars raised going back to 2014. Not so in 2021, which, in the grand scheme of things, may wind up being another outlier year.
(Past performance is no guarantee of future results.)


Latest news

Share of PE middle-market deal count by backing type
Add-ons remain the workhorse for middle-market deployment, accounting for 67. 1% of all middle-market transactions YTD, in line with activity seen in recent years.

Software deal share falls in middle markets, rises in large caps
In Q3’26 software’s share of total deals fell in both the Lower Middle Market (to 7%) and Upper Middle Market (to 9%), while Large Cap saw a modest uptick in share to 8%.

Secondary loan prices stabilize following steep declines
Secondary loan prices came under significant pressure through September and October, with the Bloomberg U.S. Leveraged Loan Index declining 119…