



Download PitchBook’s Report here.
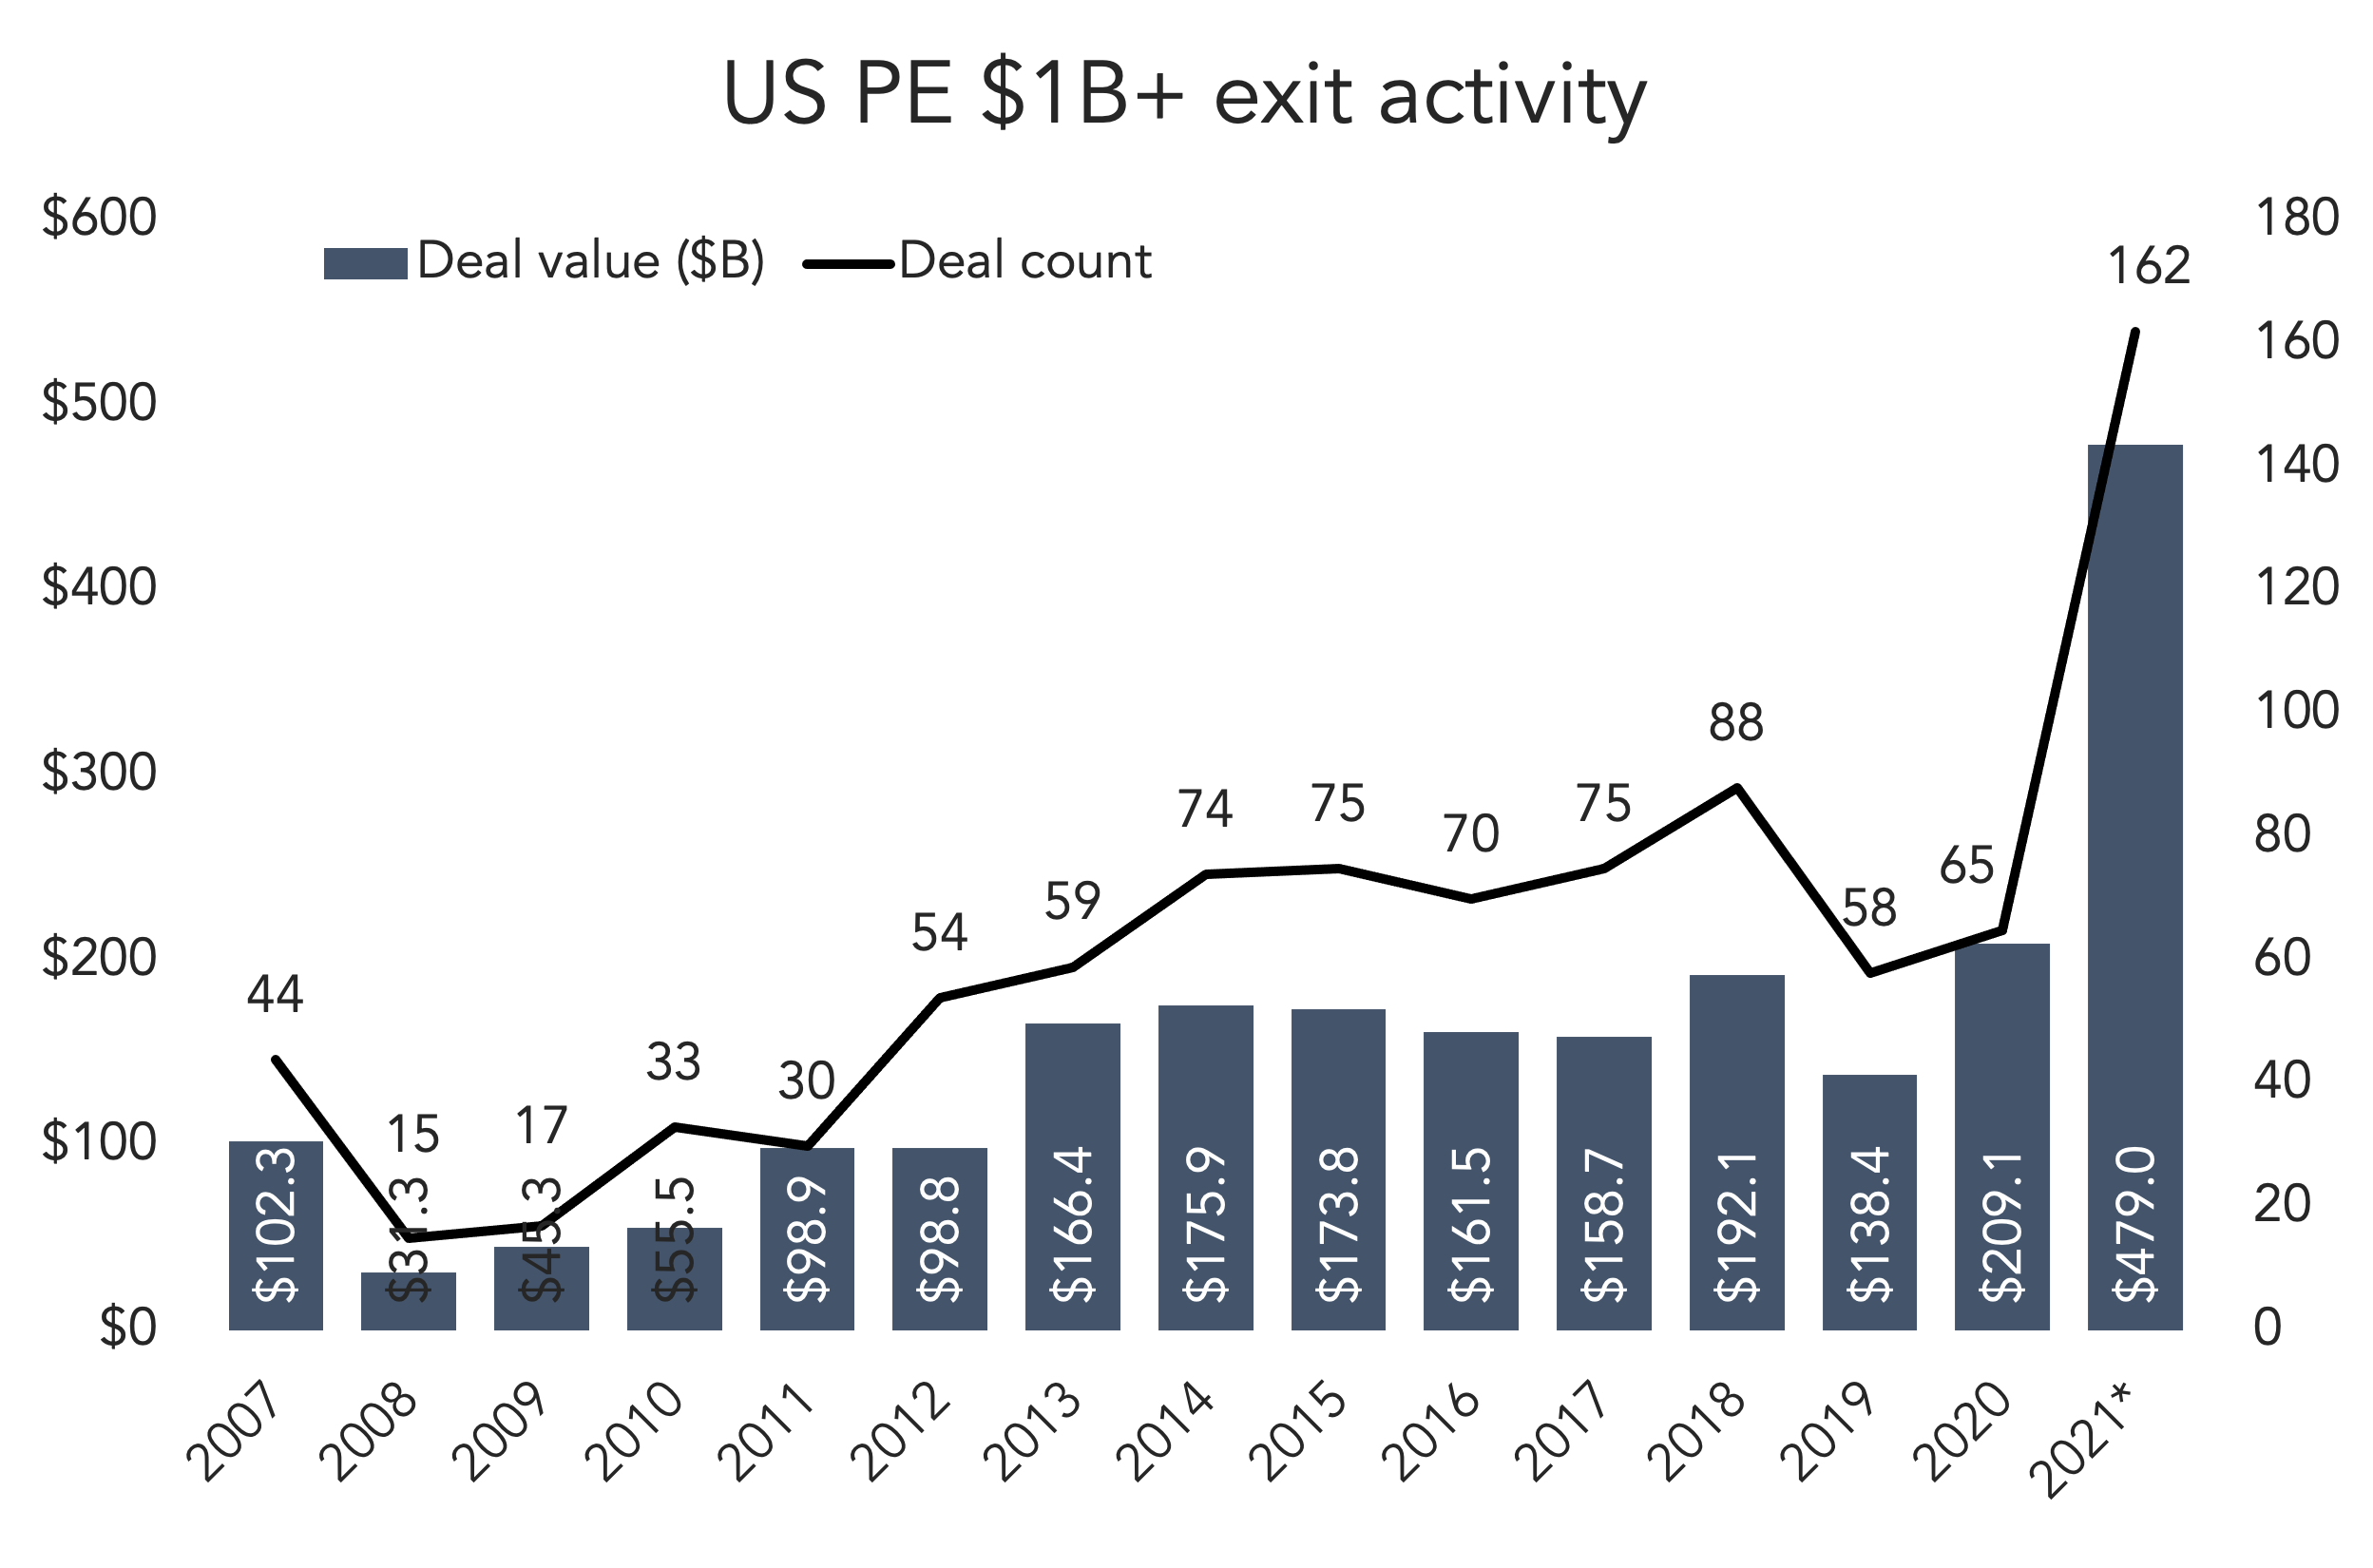
The US PE market enjoyed a wave of big exits last year, according to PitchBook’s just-released Annual Breakdown Report. 2021 was a blockbuster year for exits, fueled in large part by billion-dollar-plus sales. PitchBook counted 162 such exits, by far the most we’ve ever recorded, worth a combined $479 billion. The US PE market hadn’t seen more than 100 $1B+ exits prior to last year. Relative to all exits, $1B+ sales accounted for 9.3% of total exit deal flow. In 2020, only 6.5% of all PE exits were sized as high, with similar numbers in past years.
How much to look into it? For one thing, part of 2021’s wave included sales that would have happened in 2020, were it not for COVID. Those holdovers helped artificially boost 2021 numbers. And with good reason: Widespread uncertainty in 2020 meant much fewer game-changing deals. But when the calendar turned, the PE exit market was well on its way to a big recovery. All three exit ramps were suddenly wide open, especially the IPO market. Equally strong were corporate M&A and secondary buyout opportunities, considering how much cash and dry powder was ready to deploy. It also helped that the dust began to settle around the beginning of the year. The election was over, the vaccine was out, and buyers started to get a sense of what their markets’ “new normal” would look like. Big deals started to make more sense, especially for PE-backed companies that weathered the storm better than non-sponsored companies.
(Past performance is no guarantee of future results.)


Latest news

Share of PE middle-market deal count by backing type
Add-ons remain the workhorse for middle-market deployment, accounting for 67. 1% of all middle-market transactions YTD, in line with activity seen in recent years.

Software deal share falls in middle markets, rises in large caps
In Q3’26 software’s share of total deals fell in both the Lower Middle Market (to 7%) and Upper Middle Market (to 9%), while Large Cap saw a modest uptick in share to 8%.

Secondary loan prices stabilize following steep declines
Secondary loan prices came under significant pressure through September and October, with the Bloomberg U.S. Leveraged Loan Index declining 119…