



Download PitchBook’s Report here.
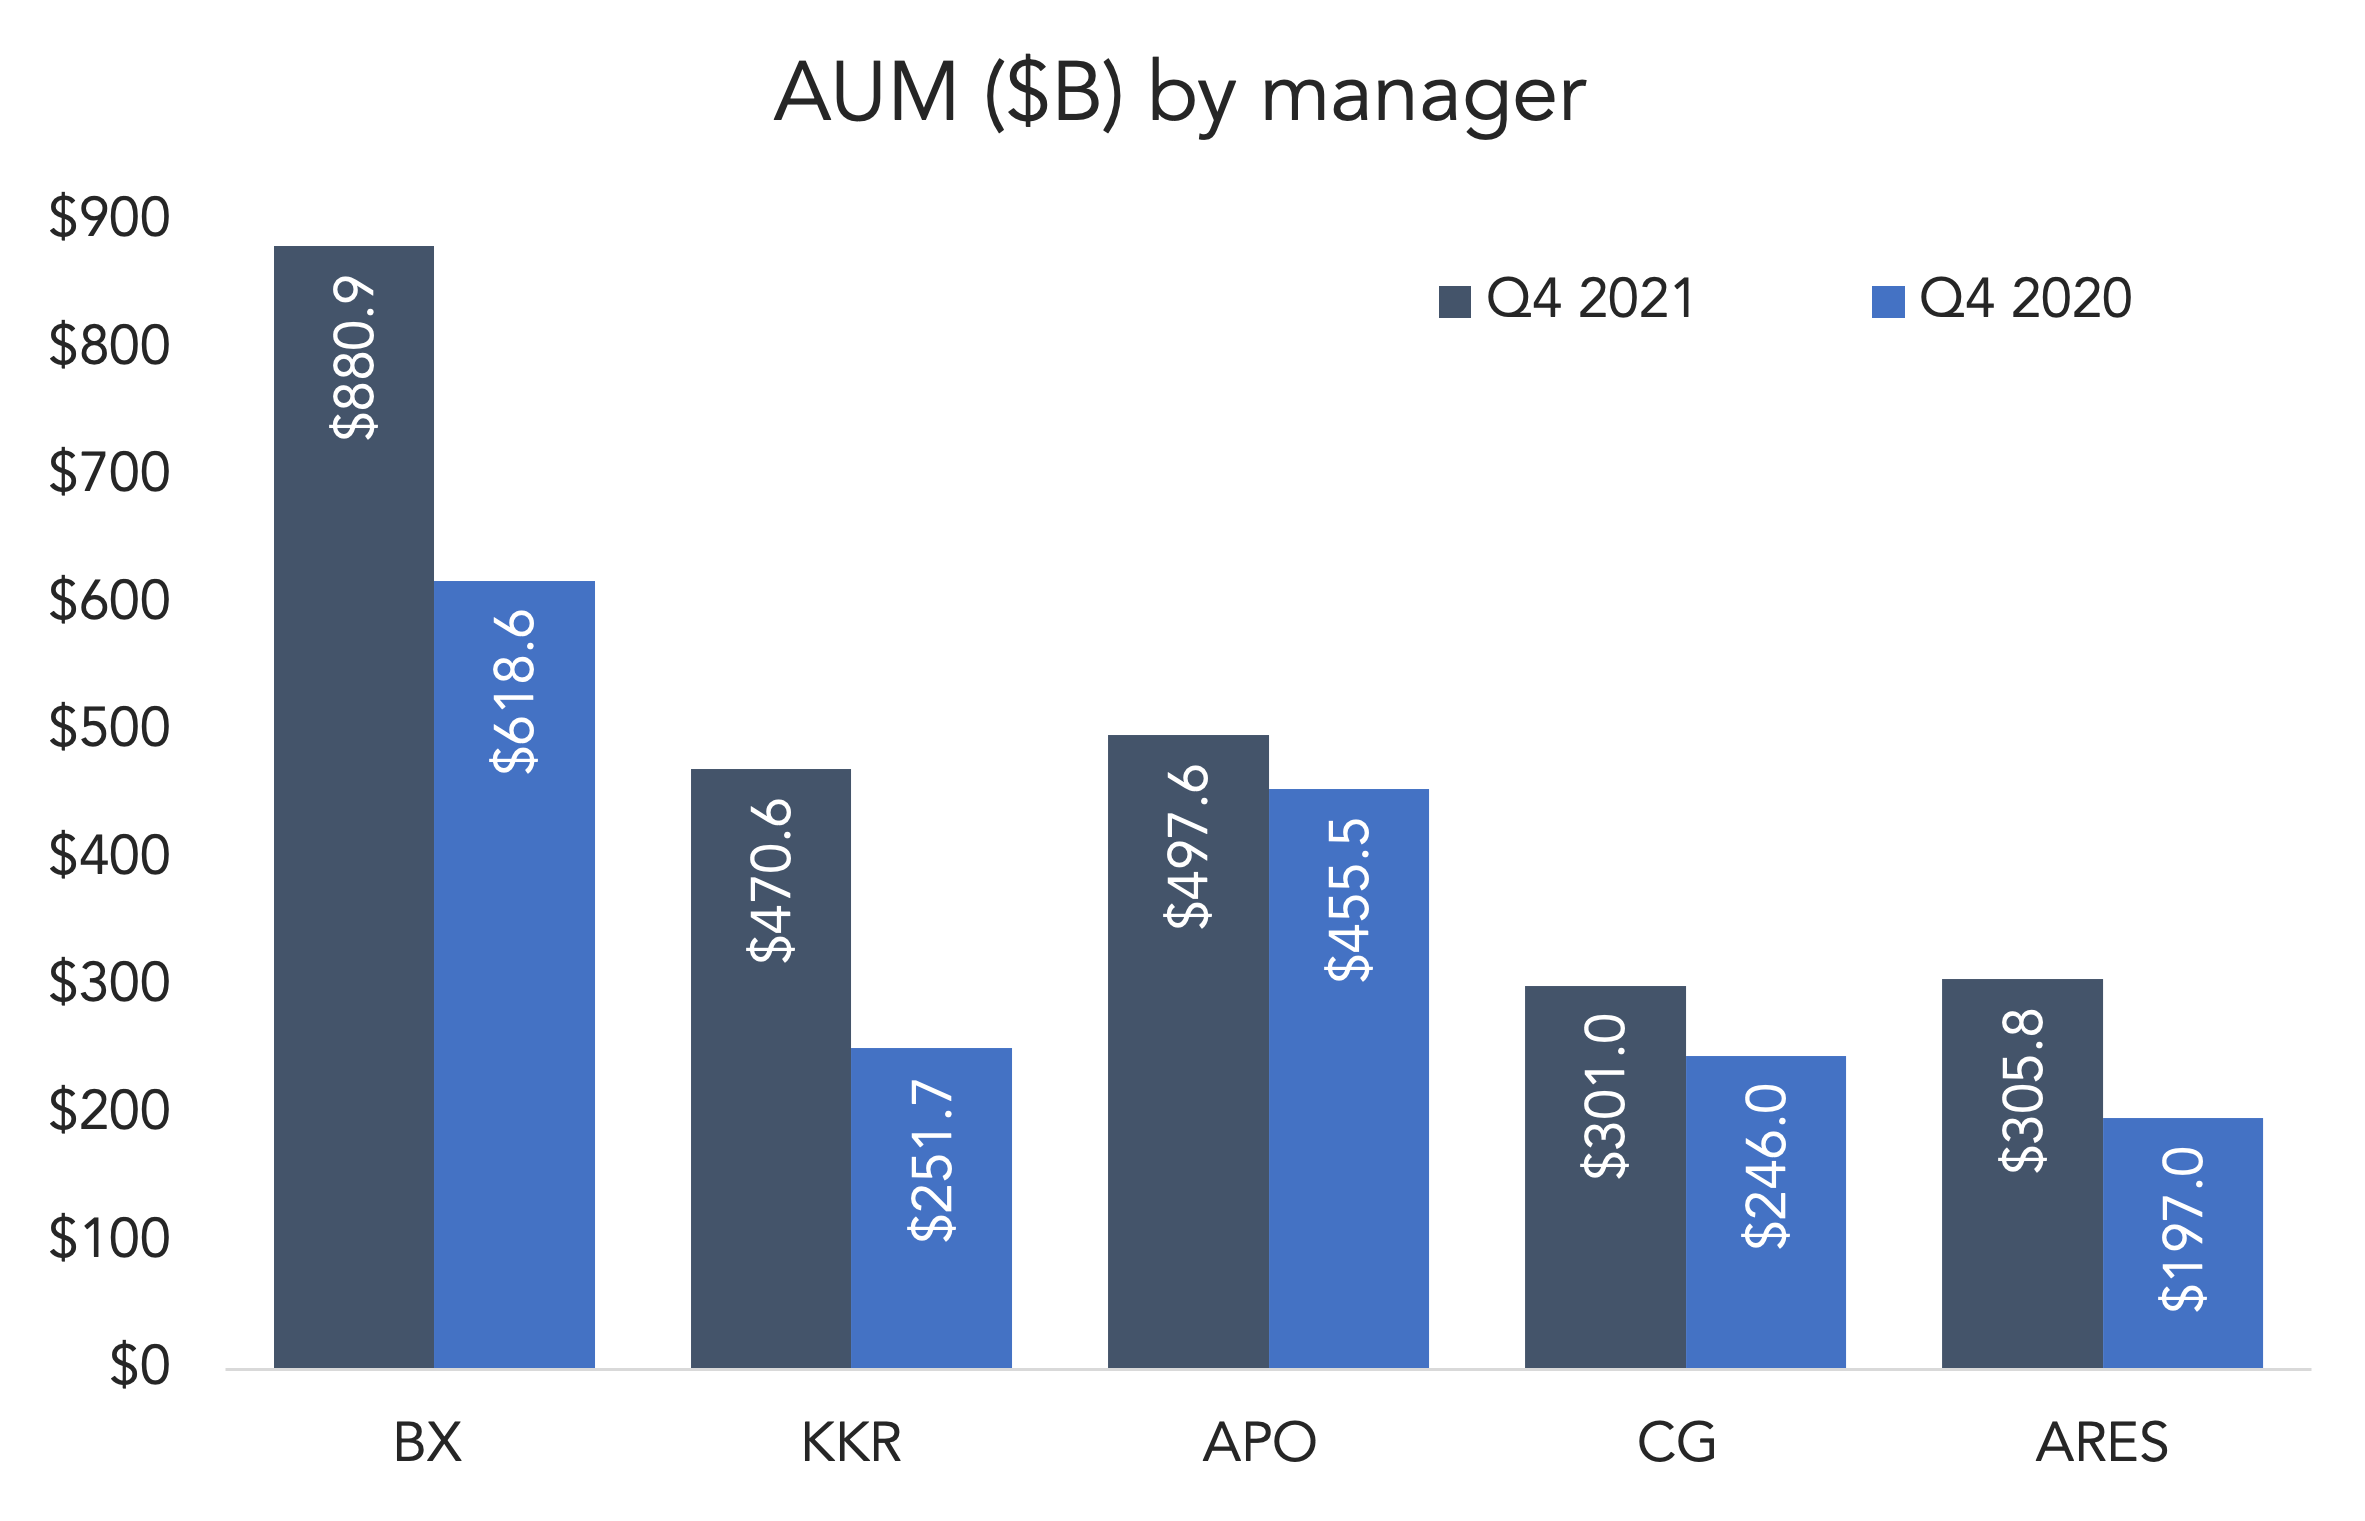
2021 was bumper year for public PE firms. PitchBook’s latest Analysis of Public US PE Firm Earnings has several interesting breakdowns, but YoY AUM trends stand out. Blackstone, KKR, Apollo, Carlyle and Ares all increased their AUMs, some more than others. KKR led the way, increasing 87% between Q4 2020 and Q4 2021. Part of that boost was its acquisition of Global Atlantic, which added more than $100 billion in assets to KKR’s books. Ares, meanwhile, grew its AUM by 55%, Blackstone by 42%, and Carlyle by 22%. The relative laggard of the group was Apollo, which grew its AUM by 9%.
Fundraising figures are often a coincidence of timing. If Blackstone closed a $20 billion fund in early January instead of late December, it wouldn’t matter much to Blackstone, but it would distort the industry’s “annual” fundraising numbers. 2021’s haul wasn’t a coincidence, though. The five firms above added a collective $687 billion to their coffers last year. Blackstone actually bested KKR on an absolute basis, increasing its AUM by $262.3 billion. The biggest firms surprised many by seeking bigger-than-expected step-ups for their latest vehicles, which span several strategies. Blackstone alone has 17 flagship funds currently in the market or launching soon. 17! On earnings calls, PE executives have been emphasizing LP appetite for yield and real assets in an inflationary environment. Thanks to that appetite, Blackstone is knocking on the door of becoming the first alternatives manager to reach $1 trillion in assets in 2022, while KKR and Apollo are both on pace to get past $500 billion this year.
(Past performance is no guarantee of future results.)


Latest news

Share of PE middle-market deal count by backing type
Add-ons remain the workhorse for middle-market deployment, accounting for 67. 1% of all middle-market transactions YTD, in line with activity seen in recent years.

Software deal share falls in middle markets, rises in large caps
In Q3’26 software’s share of total deals fell in both the Lower Middle Market (to 7%) and Upper Middle Market (to 9%), while Large Cap saw a modest uptick in share to 8%.

Secondary loan prices stabilize following steep declines
Secondary loan prices came under significant pressure through September and October, with the Bloomberg U.S. Leveraged Loan Index declining 119…