


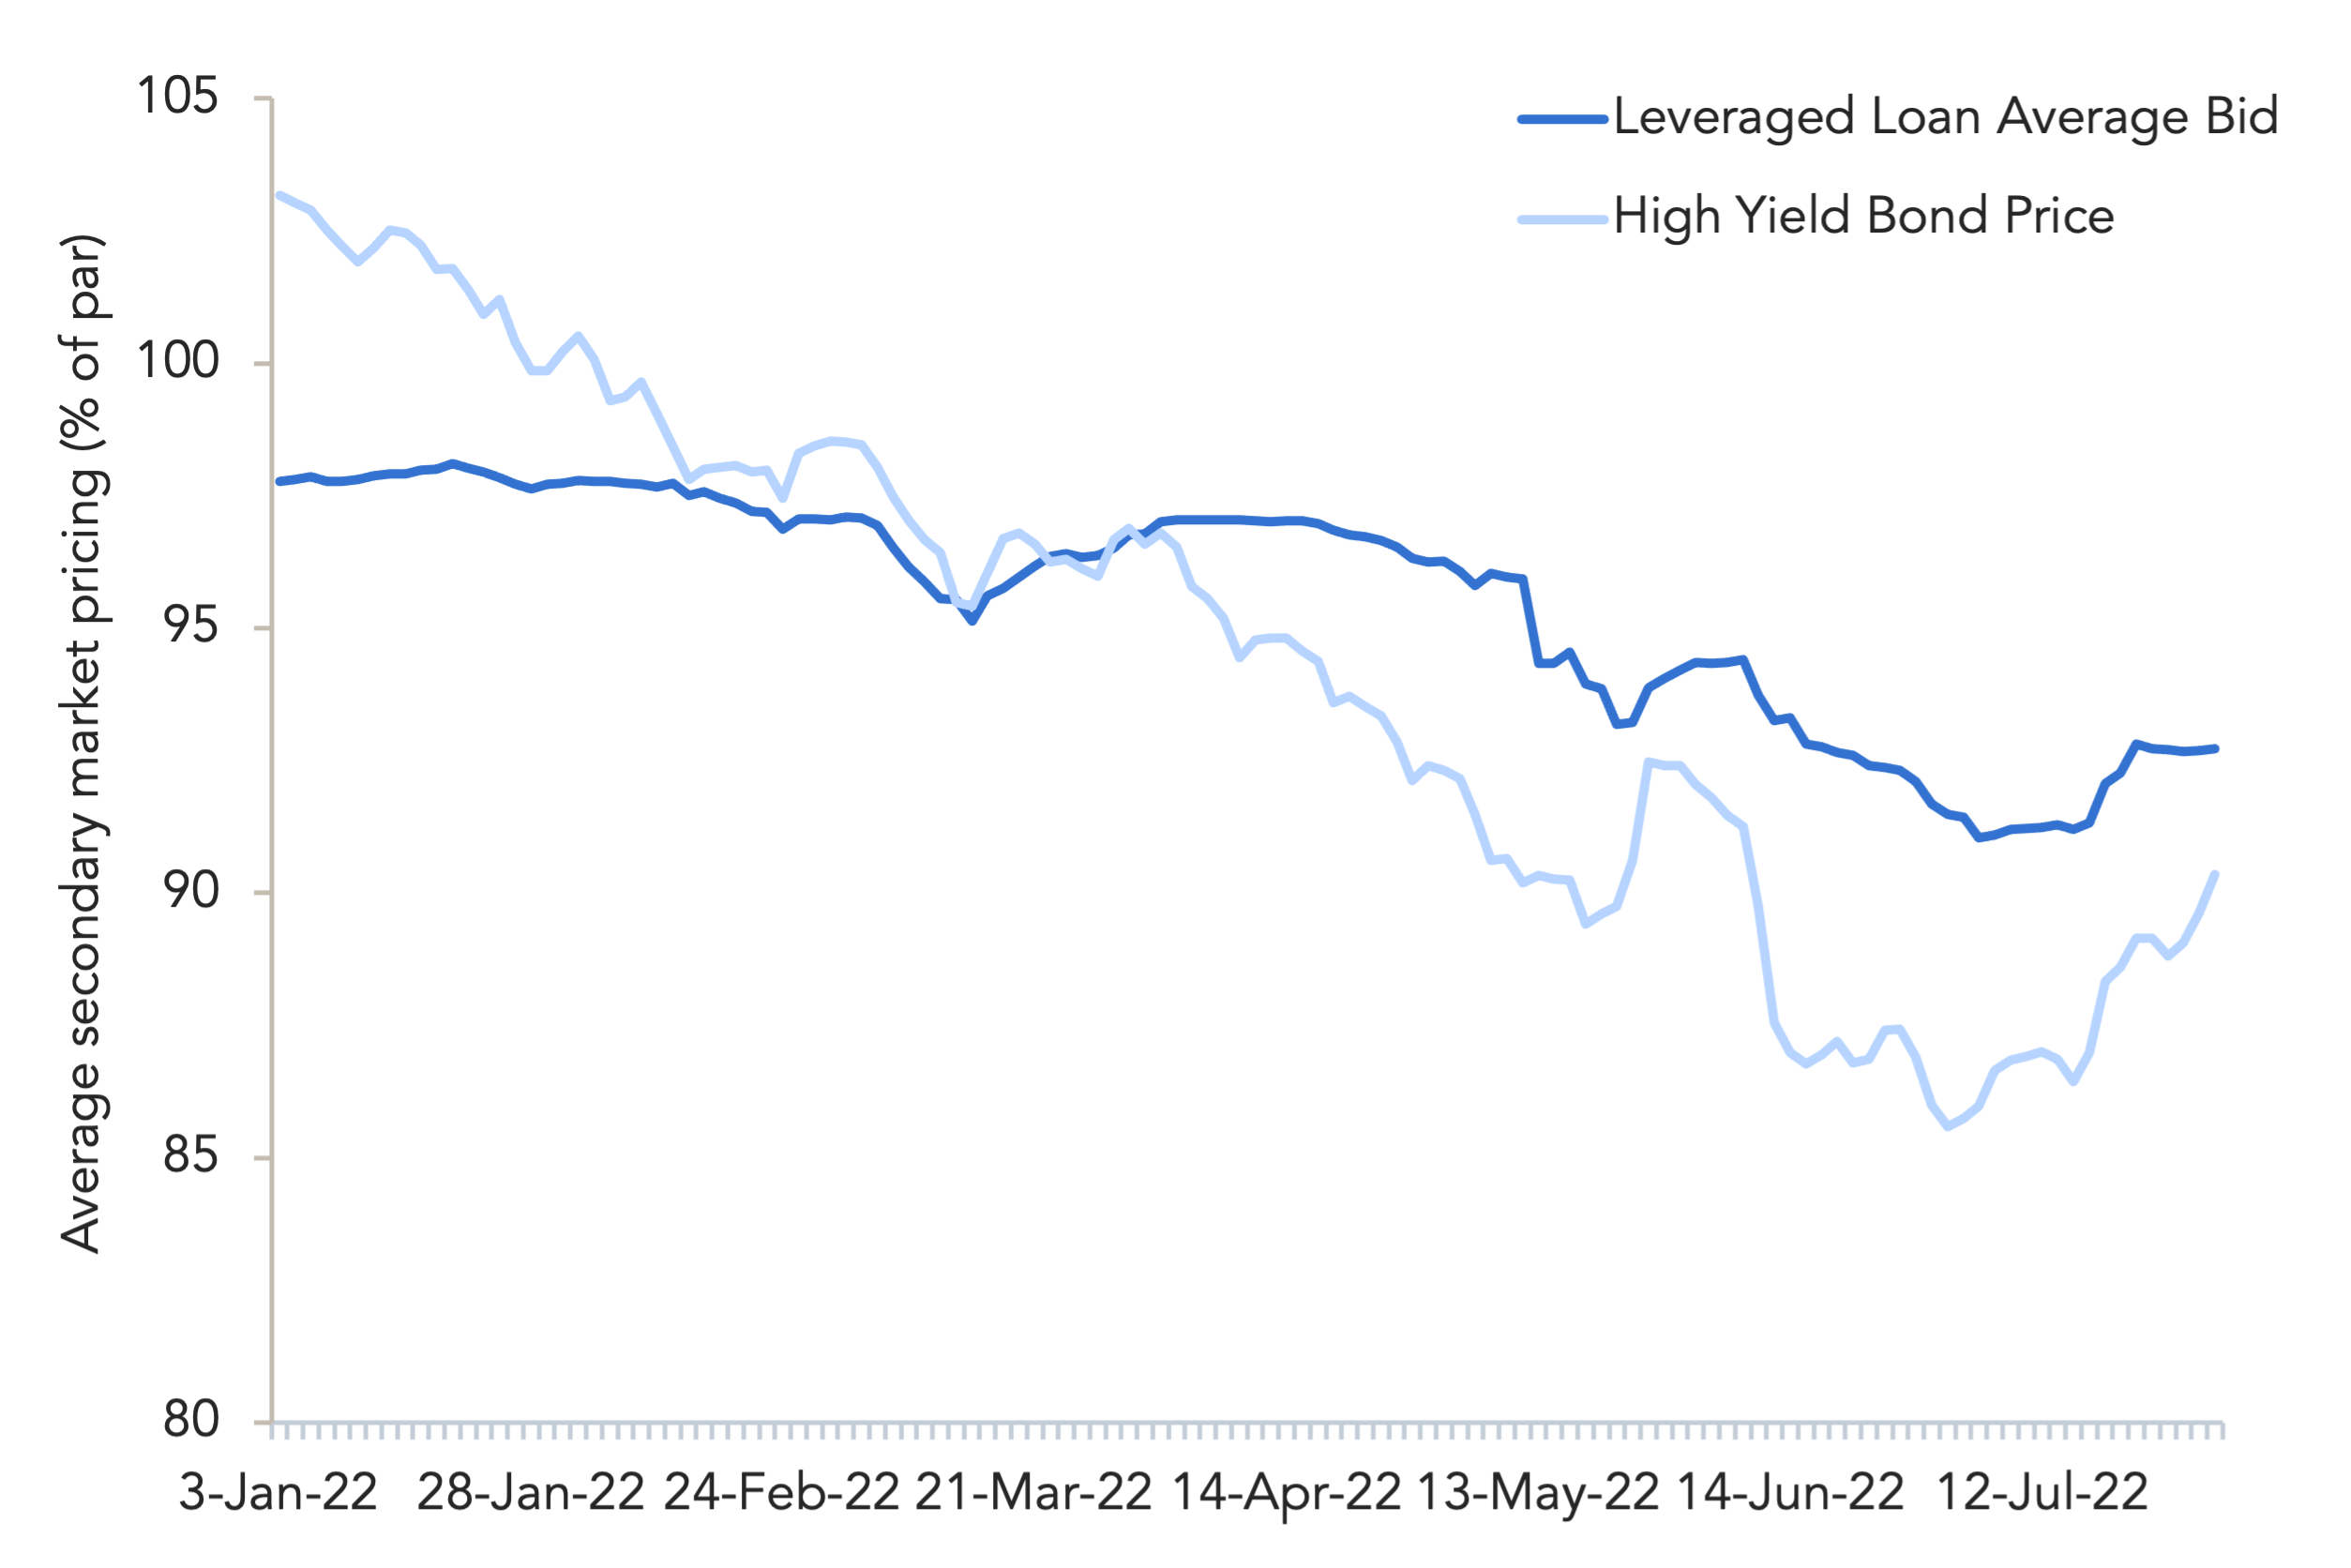
Leveraged loan and high yield bond secondary prices move up from recent lows

Source: Debtwire Par, Markit, ICE BofA US HY Index
To open the year, loans were bid at an average price of 97.78, with approximately 20% of loans bid in the par-plus range. As inflation numbers started coming in hot, and as the war in Ukraine erupted on 24 February, bids slid more than 6 points to only 91.05 on 6 July, with barely 1% of loans trading at par or better. This marked the lowest level of trading for loans since August 2020, when the market was still recovering from lockdowns imposed during the onset of the coronavirus (COVID-19) pandemic.
The drop in secondary values was even more pronounced in the high yield bond market, where average prices tumbled 18 points from the January high to just 85.58 at the end of June. Yields in turn shot up to nearly 9% from 4.42% in January, marking the largest spike in yields since April 2020 – the height of coronavirus induced lockdowns. Investors fled the fixed-rate asset class amid rising rates in drastic numbers, with nearly USD 35bn flowing out of high yield funds through June, according to Lipper.
In the last month, however, secondary prices have moved up from their recent lows. Loan prices gained approximately 124bps in July, with the average bid landing at 92.72. High yield bonds, meanwhile, saw prices appreciate nearly five points, to 90.36 – the highest level seen since early June. Yields have in turn fallen to 7.5% during the same time. Through July, high yield funds actually saw a net inflow of more than USD 4bn, helping to drive up pricing in the secondary market.
Investors who did jump on the bargain prices offered in the bond market were rewarded with a 5.6% return in July, which brings the year-to-date loss down to 8.9%.
(Past performance is no guarantee of future results.)



Latest news

Top 50 BDCs Accounted for 75% of Nonaccrual Loan Cost in Q2’26
The 50 largest BDCs, on the basis of total debt investments as of the second quarter of 2026, accounted for 75% of the total aggregate reported value of nonaccrual debt at cost and fair value.

US private debt AUM ($B) by channel
In 2025 and the early part of 2026, the retail channel added AUM to the asset class at a much faster rate than institutional investors in both regions, with growth rates of 43.7% globally, 41.4% in the US, and 73. 1% in Europe through the beginning of 2026 compared with year-end 2024 figures.
