



Download PitchBook’s Report here.
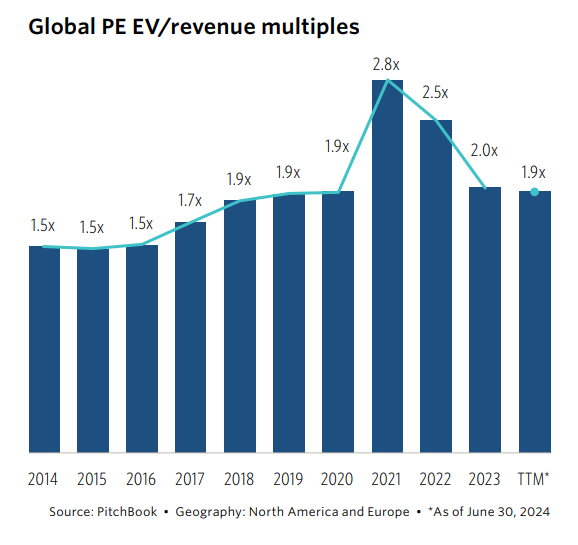
Revenue multiples saw a much more aggressive run-up to the peak reached in 2021 and a much faster descent thereafter. In Q1 2024, we saw initial signs of distressed selling and capitulation. EV/revenue multiples lurched downward to 1.4x from a median TTM of 2.0x at the beginning of the quarter. We normally do not extrapolate three-month trends in multiples given the volatility of the data, and we were keen to see evidence of any follow-through in Q2. The snapback in Q2 multiples to a median of 1.9x indicates that the storm may have passed for now, and we suspect it reflects the breathing room gained from lower borrowing costs and the halo effect from strong public markets.
(Past performance is no guarantee of future results.)




Latest news

US leveraged loans returns turn negative in October
The Bloomberg US Leveraged Loan Index (Ticker: LOAN) has returned -0.26% this month through October 21, reducing its year-to-date return…

M&A activity begins to tick upward
In the third quarter of 2026, acquisition-linked loan volume across North America and Europe reached about $47 billion, up from $30.6 billion in Q2 and $29.5 billion a year ago.
