



Download PitchBook’s Report here.
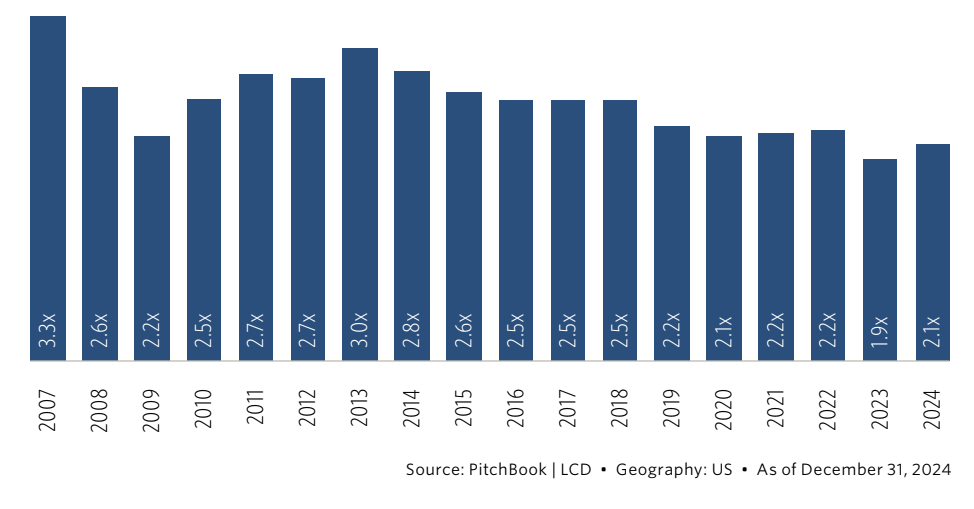
Greater leverage is another key distinguishing characteristic of buyout-backed companies. Over the past 10 years, the average publicly traded small-cap company has had a financial leverage ratio of total assets to market equity of around 1.4x. Meanwhile, postdeal buyout-backed companies typically have had financial leverage ratios of around 2.5x during this same period, although they have come down recently in response to higher interest rates. Greater financial leverage has been an important tailwind to buyout fund performance during the analysis period, as the return on portfolio companies’ assets has easily outpaced the historically low cost of debt.
(Past performance is no guarantee of future results.)

Latest news

US alt IMs remain resilient amid macroeconomic challenges
Alternative investment managers’ (alt IMs) credit profiles remain resilient amid a challenging macroeconomic backdrop.

BDC redemption requests remain elevated
BDC redemption requests remained elevated in 3Q26, continuing a trend that gained prominence in recent quarters. Among the nine largest…

Capital flows begin to weaken
Our latest test of investor opinion finds increased wariness to committing more to private credit. It started as a small…