



Download PitchBook’s Report here.
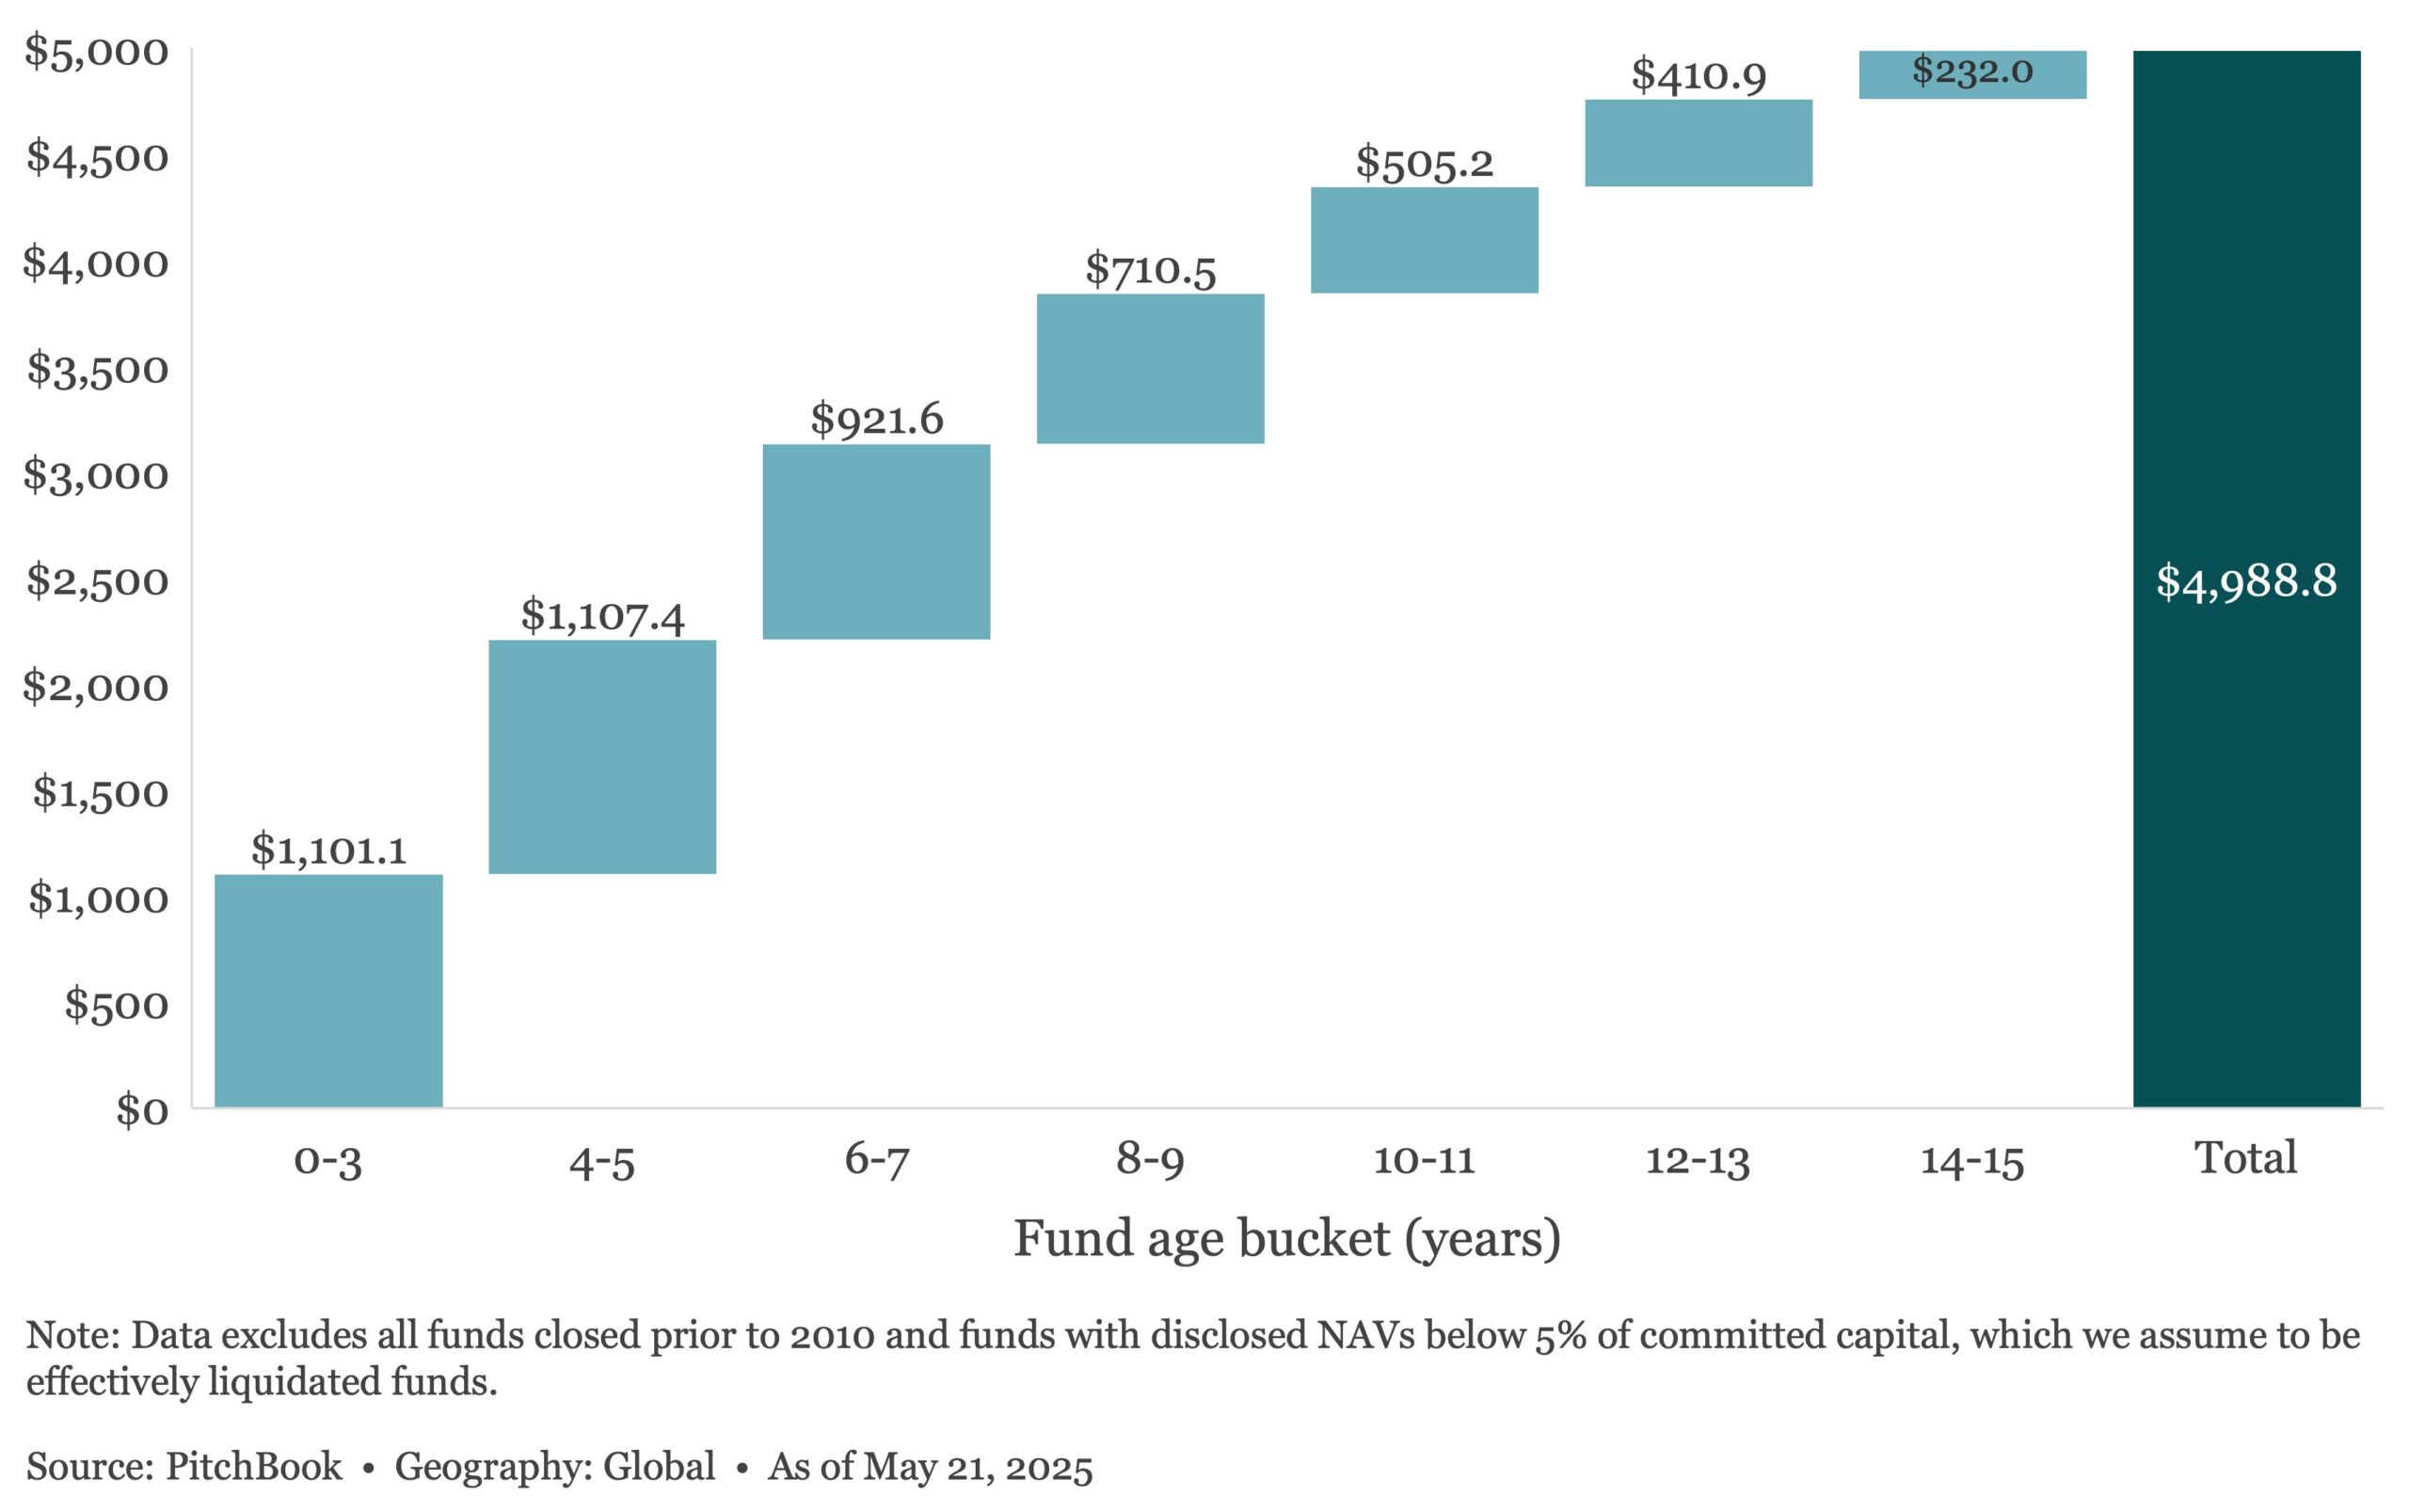
Looking at the funds that face the most imminent fund terms, 11.8% of active funds are 10 to 11 years old, and 13.7% of active funds are 8 to 9 years old. This means that 1,420 funds will need to be wound down this year or in 2026 or secure extensions, while another 1,649 funds will reach their 10-year fund term in the next year or two. Furthermore, funds 10 years or older have increased both in absolute number and as a share of the total PE fund count. The number of active funds 10 years or older increased from 2,698 at the end of 2024 to 3,119 funds as of May 2025, accounting for 25.9% of the total PE fund count, up from 23.2%. This is another concerning development that shows funds are indeed struggling to liquidate at and past maturity. At the same time, the recent recovery in exit activity is nascent and likely to face headwinds from macroeconomic uncertainties throughout 2025. The global PE company inventory swelled to 30,466 companies through Q1 2025, which translates to an eight-year inventory at the observed pace of exits in 2024. Although this is a rough estimate, annualized Q1 2025 exit activity suggests exit count will decrease once again in 2025. Unless GPs significantly speed up their pace of exits, the number of funds confronted with a maturity wall will continue to snowball.
(Past performance is no guarantee of future results.)





Latest news

Rate hike expectations ease as term SOFR curve flattens
The CME six-month Term SOFR rate reached a recent high of 3.979% on July 28 before retreating to 3.837% as…

3Q26: New loan assets rise to 44% of total lending, a 3-year high
New loan assets as a proportion of total US loan volume make up 44% of the 3Q26 pipeline to date,…

North American GPs dominant as fundraising accelerates
Our PEI Private Credit 200 ranking also shows capital raising increasing overall – and accelerating especially fast for the largest…