



Download PitchBook’s Report here.
We tend to think of PE’s halcyon days as 2005-07, the dealmaking and fundraising bonanza years right before the music stopped. Industry players who have been around long enough probably remember better times and slightly better numbers. The industry is certainly much bigger and busier than it used to be, but not necessarily better, at least in terms of across-the-board outperformance.
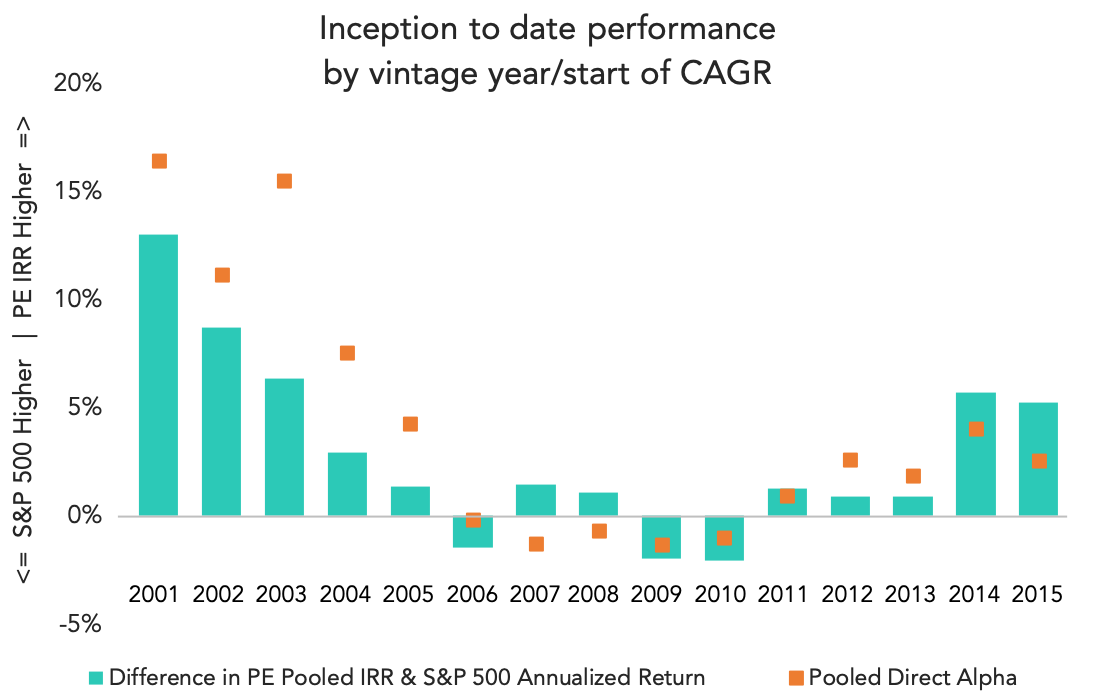
For the early 2000s vintages, PE funds in aggregate generated alpha values ranging between 7.5% and 16.4%, according to PitchBook’s just-released Benchmarks report. The graph above tries to capture Direct Alpha, which can be thought of as “an annualized KS-PME”—public market equivalent—that takes into account “both the performance of the reference benchmark and precise times at which capital is actually deployed.” The highlight-reel vintages of 2001-03 combined below-average public market performance (dot-com burst) and above-average PE gains, when the asset class was still relatively greenfield. PE’s hardest relative performance, not surprisingly, came during and around the financial crisis, when pooled direct alpha slipped into negative territory for the first time. Direct alpha recovered by 2011, but relative outperformance remained pretty stagnant over the next four vintages.
Alpha might be harder to find, despite marketing materials that say otherwise. Bull markets can be fairly blamed, but active managers are supposed to outrun the bulls. It might be a combination of more (more data, more investors, more dry powder) and less (less arbitrage, less companies, less options) that are the true pain points across PE and a slew of other asset classes. Private equity’s calling card, though, has been information and control over that information. Put another way, PE sponsors can make fundamental changes to their portfolio companies without letting the rest of the market know what those changes are every three months. That’s supposed to be a key advantage over the public market. Private equity can take a truly long-term approach to influence the direction of its investments in ways that other asset classes can’t.


Latest news

Share of PE middle-market deal count by backing type
Add-ons remain the workhorse for middle-market deployment, accounting for 67. 1% of all middle-market transactions YTD, in line with activity seen in recent years.

Software deal share falls in middle markets, rises in large caps
In Q3’26 software’s share of total deals fell in both the Lower Middle Market (to 7%) and Upper Middle Market (to 9%), while Large Cap saw a modest uptick in share to 8%.

Secondary loan prices stabilize following steep declines
Secondary loan prices came under significant pressure through September and October, with the Bloomberg U.S. Leveraged Loan Index declining 119…