



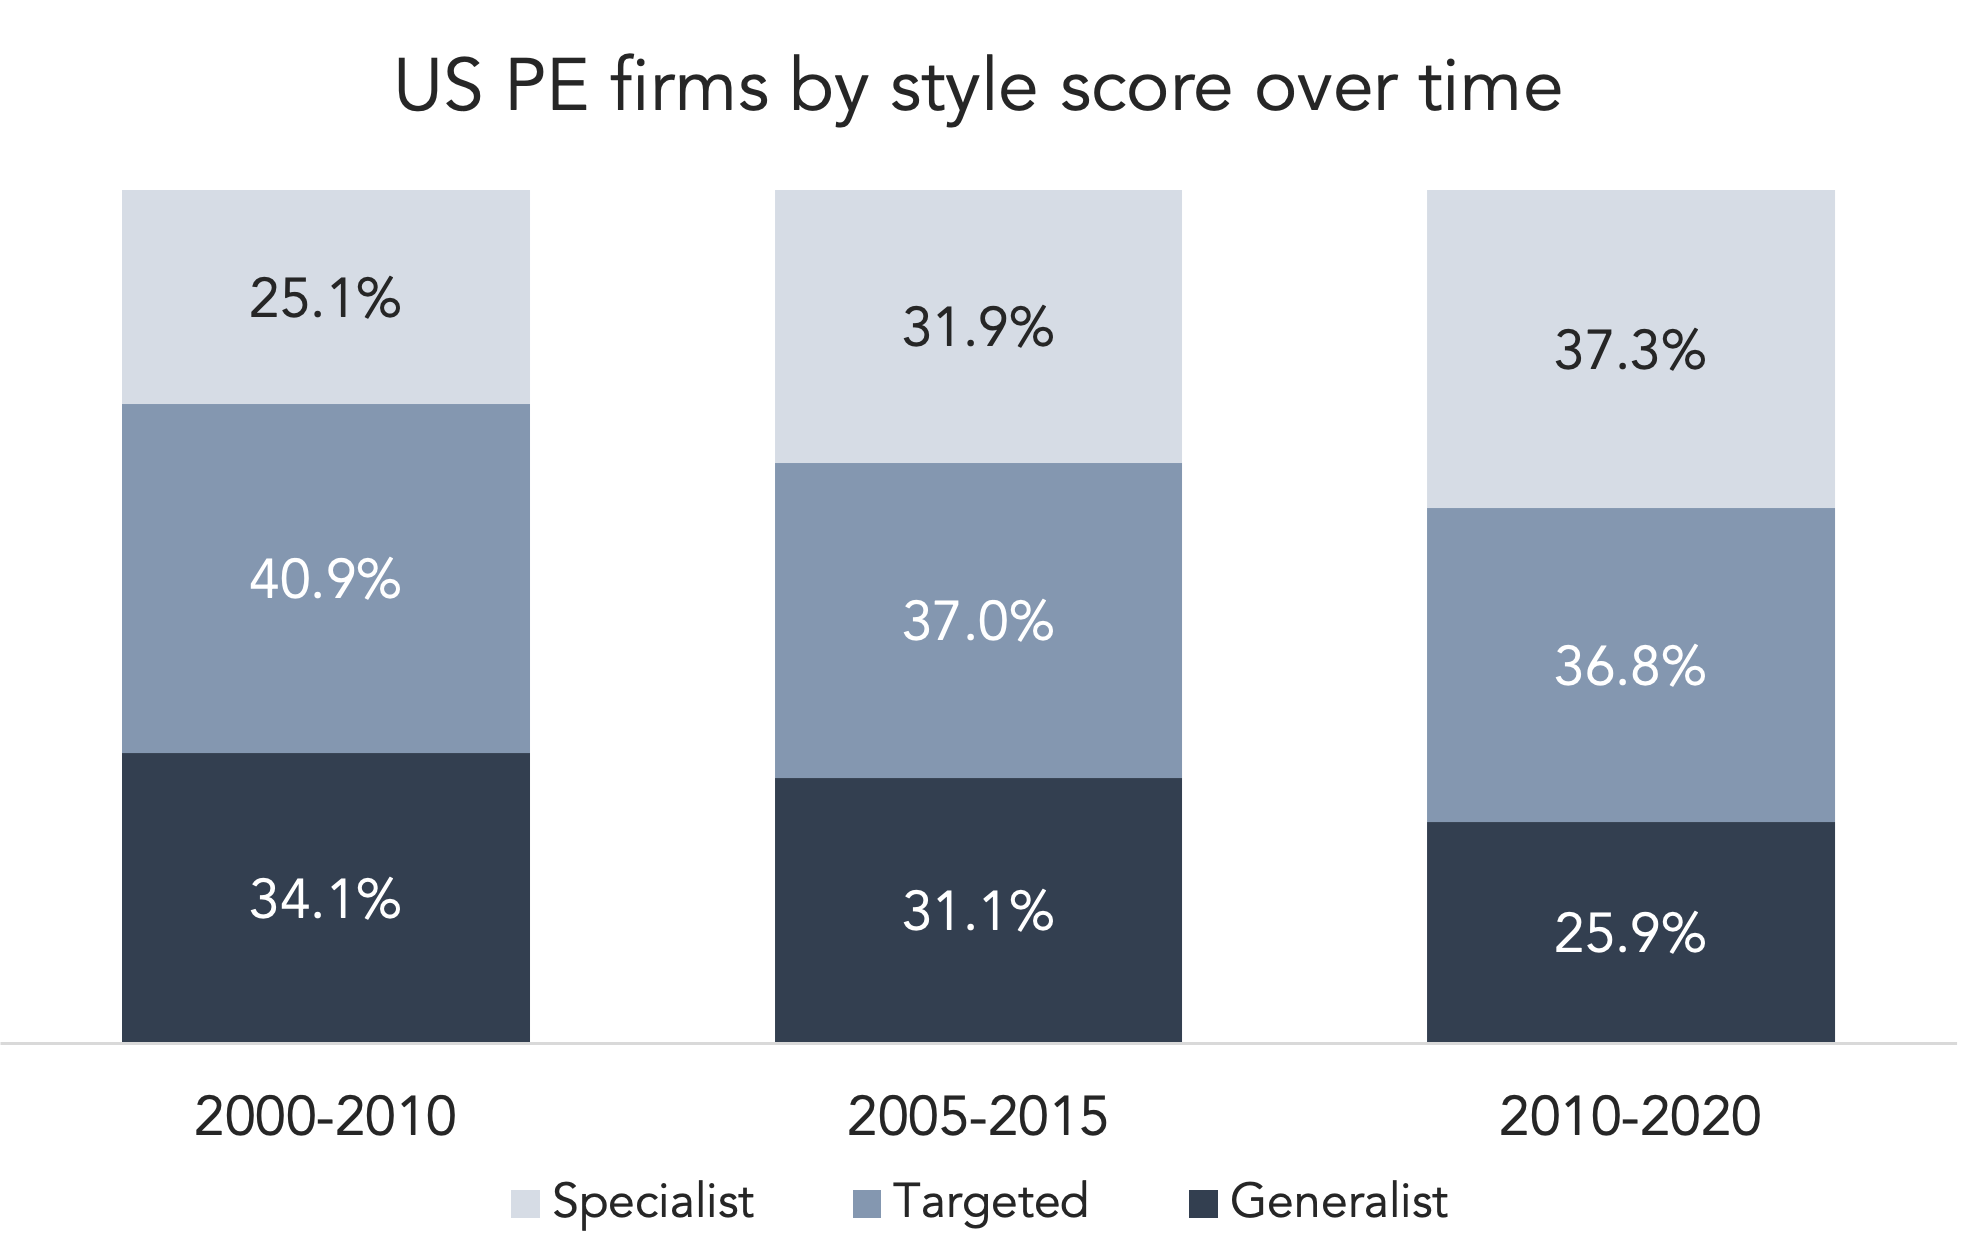
An upcoming PitchBook analyst note takes a look at GP style drift. It’s an important topic but a frustrating one for LPs. Quantifying the drift is tricky. Our framework assigns style scores to the PE firms themselves over time, instead of at the fund level. We broke the style definitions into three broad categories—generalists, specialists, and “targeted”, which is something of a middle-ground between the two extremes. The time element is staggered, with overlapping ten-year buckets that show the gradual drifts over time.
In the chart above, the obvious trend is a shift away from the generalist category and a growing representation for specialists. Between 2000 and 2010, generalists accounted for 34.1% of the PE universe compared to only 25.9% for the 2010-2020 vintage bucket. The opposite happened for specialists, which now account for 37.3% of all PE firms compared to 25.1% a decade earlier. The “targeted” category doesn’t shift very much in percentage terms, but that’s actually where most of the action happens. Generalists can become narrower over time while specialists can expand their focuses as they grow. Both would eventually wind up in the same middle category.
All of this is important for LPs, who are concerned about the trend. More specialization is a positive overall, but as LPs have become more sophisticated, so have their allocation models. A hypothetical LP might target a 10% allocation to consumer-focused funds and another 10% to software focused ones. GPs that decide to go in different directions, however slight, can cause a ripple effect across dozens of LP portfolios. There’s also the concern that they’ll be able to pull off the transition. Second basemen and third basemen are both infielders but require slightly different skillsets to do their jobs well. By definition, LPs have limited control over internal decision-making at the GP level; they can’t be team manager and require their players to stay in one spot. The hope is that the transition works out well and returns don’t suffer. They may need to find another second basemen to get their allocations intact again, too.
Contact: Alex Lykken
alex.lykken@pitchbook.com


Latest news

Share of PE middle-market deal count by backing type
Add-ons remain the workhorse for middle-market deployment, accounting for 67. 1% of all middle-market transactions YTD, in line with activity seen in recent years.

Software deal share falls in middle markets, rises in large caps
In Q3’26 software’s share of total deals fell in both the Lower Middle Market (to 7%) and Upper Middle Market (to 9%), while Large Cap saw a modest uptick in share to 8%.

Secondary loan prices stabilize following steep declines
Secondary loan prices came under significant pressure through September and October, with the Bloomberg U.S. Leveraged Loan Index declining 119…