More add-ons in the MM

PB icon
Content hub / Article / PitchBook / More add-ons in the MM


Download PitchBook’s Report here.

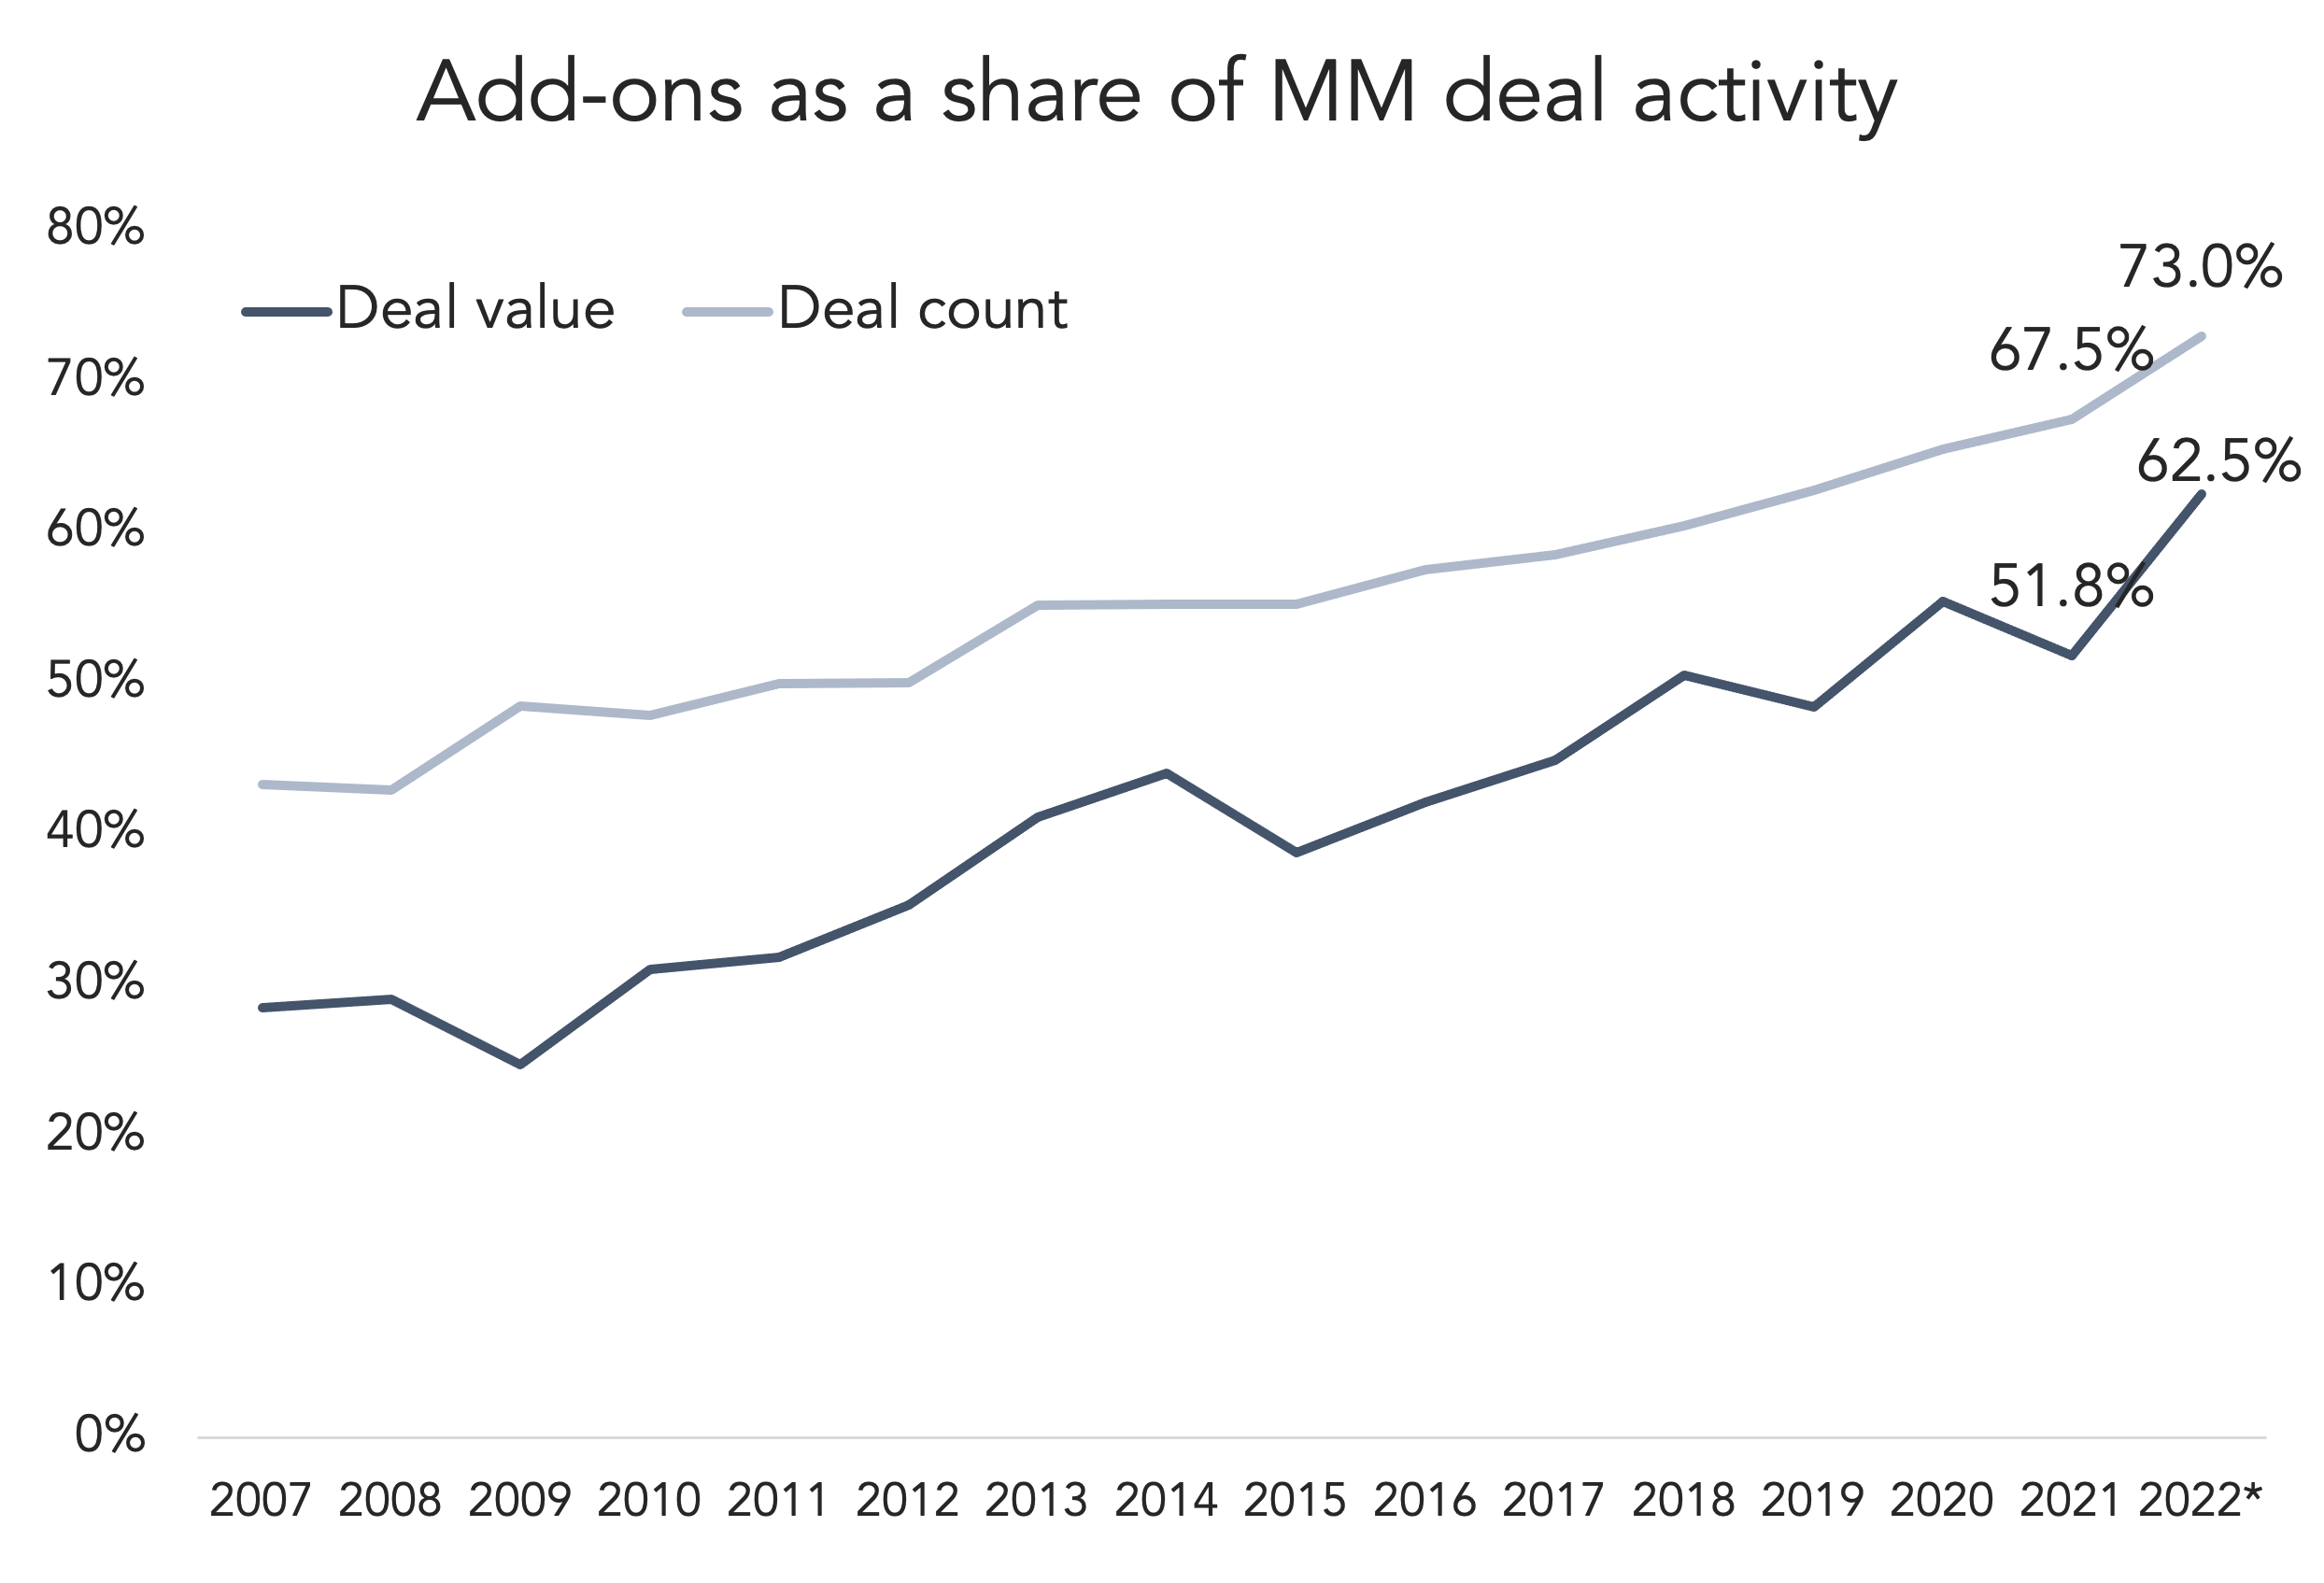
The ratio of add-ons in the middle market is increasing, according to PitchBook’s Q2 2022 US PE Middle Market Report. That’s been an evergreen trend for the past decade, but it appeared to go into overdrive in 2022. Add-ons now account for 73% of all middle market activity, up from 67.5% last year. One of the hallmarks of 2021 was a rush to buy new platforms—in the buy-and-build era, when LBOs increase, the add-ons aren’t far behind. And because investors have become so proactive with buy-and-build—sometimes identifying add-on targets before talking to the platform target—the add-on numbers would increase pretty quickly after a year like 2021.

There should be a theoretical ceiling for the chart above. Ten years ago, add-ons accounted for half of all middle market activity, and we’re now almost at 75%. Is it possible to see 80%? It could be over the next couple of years. Investors will be executing on their growth plans for their new platform companies, while the market for new LBOs appears to be chilling. An 80% reading wouldn’t be very actionable for investors, but it would be a remarkable reflection of the buy-and-build model over the past decade.

(Past performance is no guarantee of future results.)

Contact Alex Lykken
Business development companies and the rise of balance sheet financing vehicles

Podcast

Business development companies and the rise of balance sheet financing vehicles

Fitch's Deb Murnin and Chelsea Richardson discuss the growing use of off-balance-sheet JVs and finance companies among BDCs, exploring the drivers, leverage impacts, portfolio risk profiles, and potential rating implications for Fitch-rated BDCs.
Listen
Private Debt Investor New York Forum

September 15-16, Hudson Yards, New York

Private Debt Investor New York Forum

Bringing together the investors, managers and advisers shaping the next phase of the market — 200+ allocators and $10.6 trillion of LP capital expected. Benchmark strategies, hear from leading LPs, and cut through market noise over two unmissable days.
Learn more
US Private Credit League Tables H1'26

Report

US Private Credit League Tables H1'26

The definitive rankings covering private credit activity in H1'26.
Download
PitchBook's Q2 2026 US PE Breakdown

Report

PitchBook's Q2 2026 US PE Breakdown

Software freezes and energy powers on as US PE deal value falls 38% in Q2 2026.
Download
Making sense of private credit defaults

Webinar

Making sense of private credit defaults

What does private credit default data really tell us? Join our exclusive webinar featuring experts from KBRA, Moody's, Fitch Ratings, and S&P Global to find out.
Register

Latest news

    Rate Hike Expectations Regain Steam following Jackson Hole

    The CME six-month Term SOFR rate reached a recent high of 3.979% on July 28 before retreating to 3.821% as…

    Read More

    Private Credit Defaults 101: Back to School

    As Labor Day approaches, the unofficial end of summer is upon us. But, before we get too sad, there is also the familiar back-to-school energy.

    Read More

    Grading on a Curve

    Grades depend on how the questions get answered.

    Read More