



Download PitchBook’s Report here.
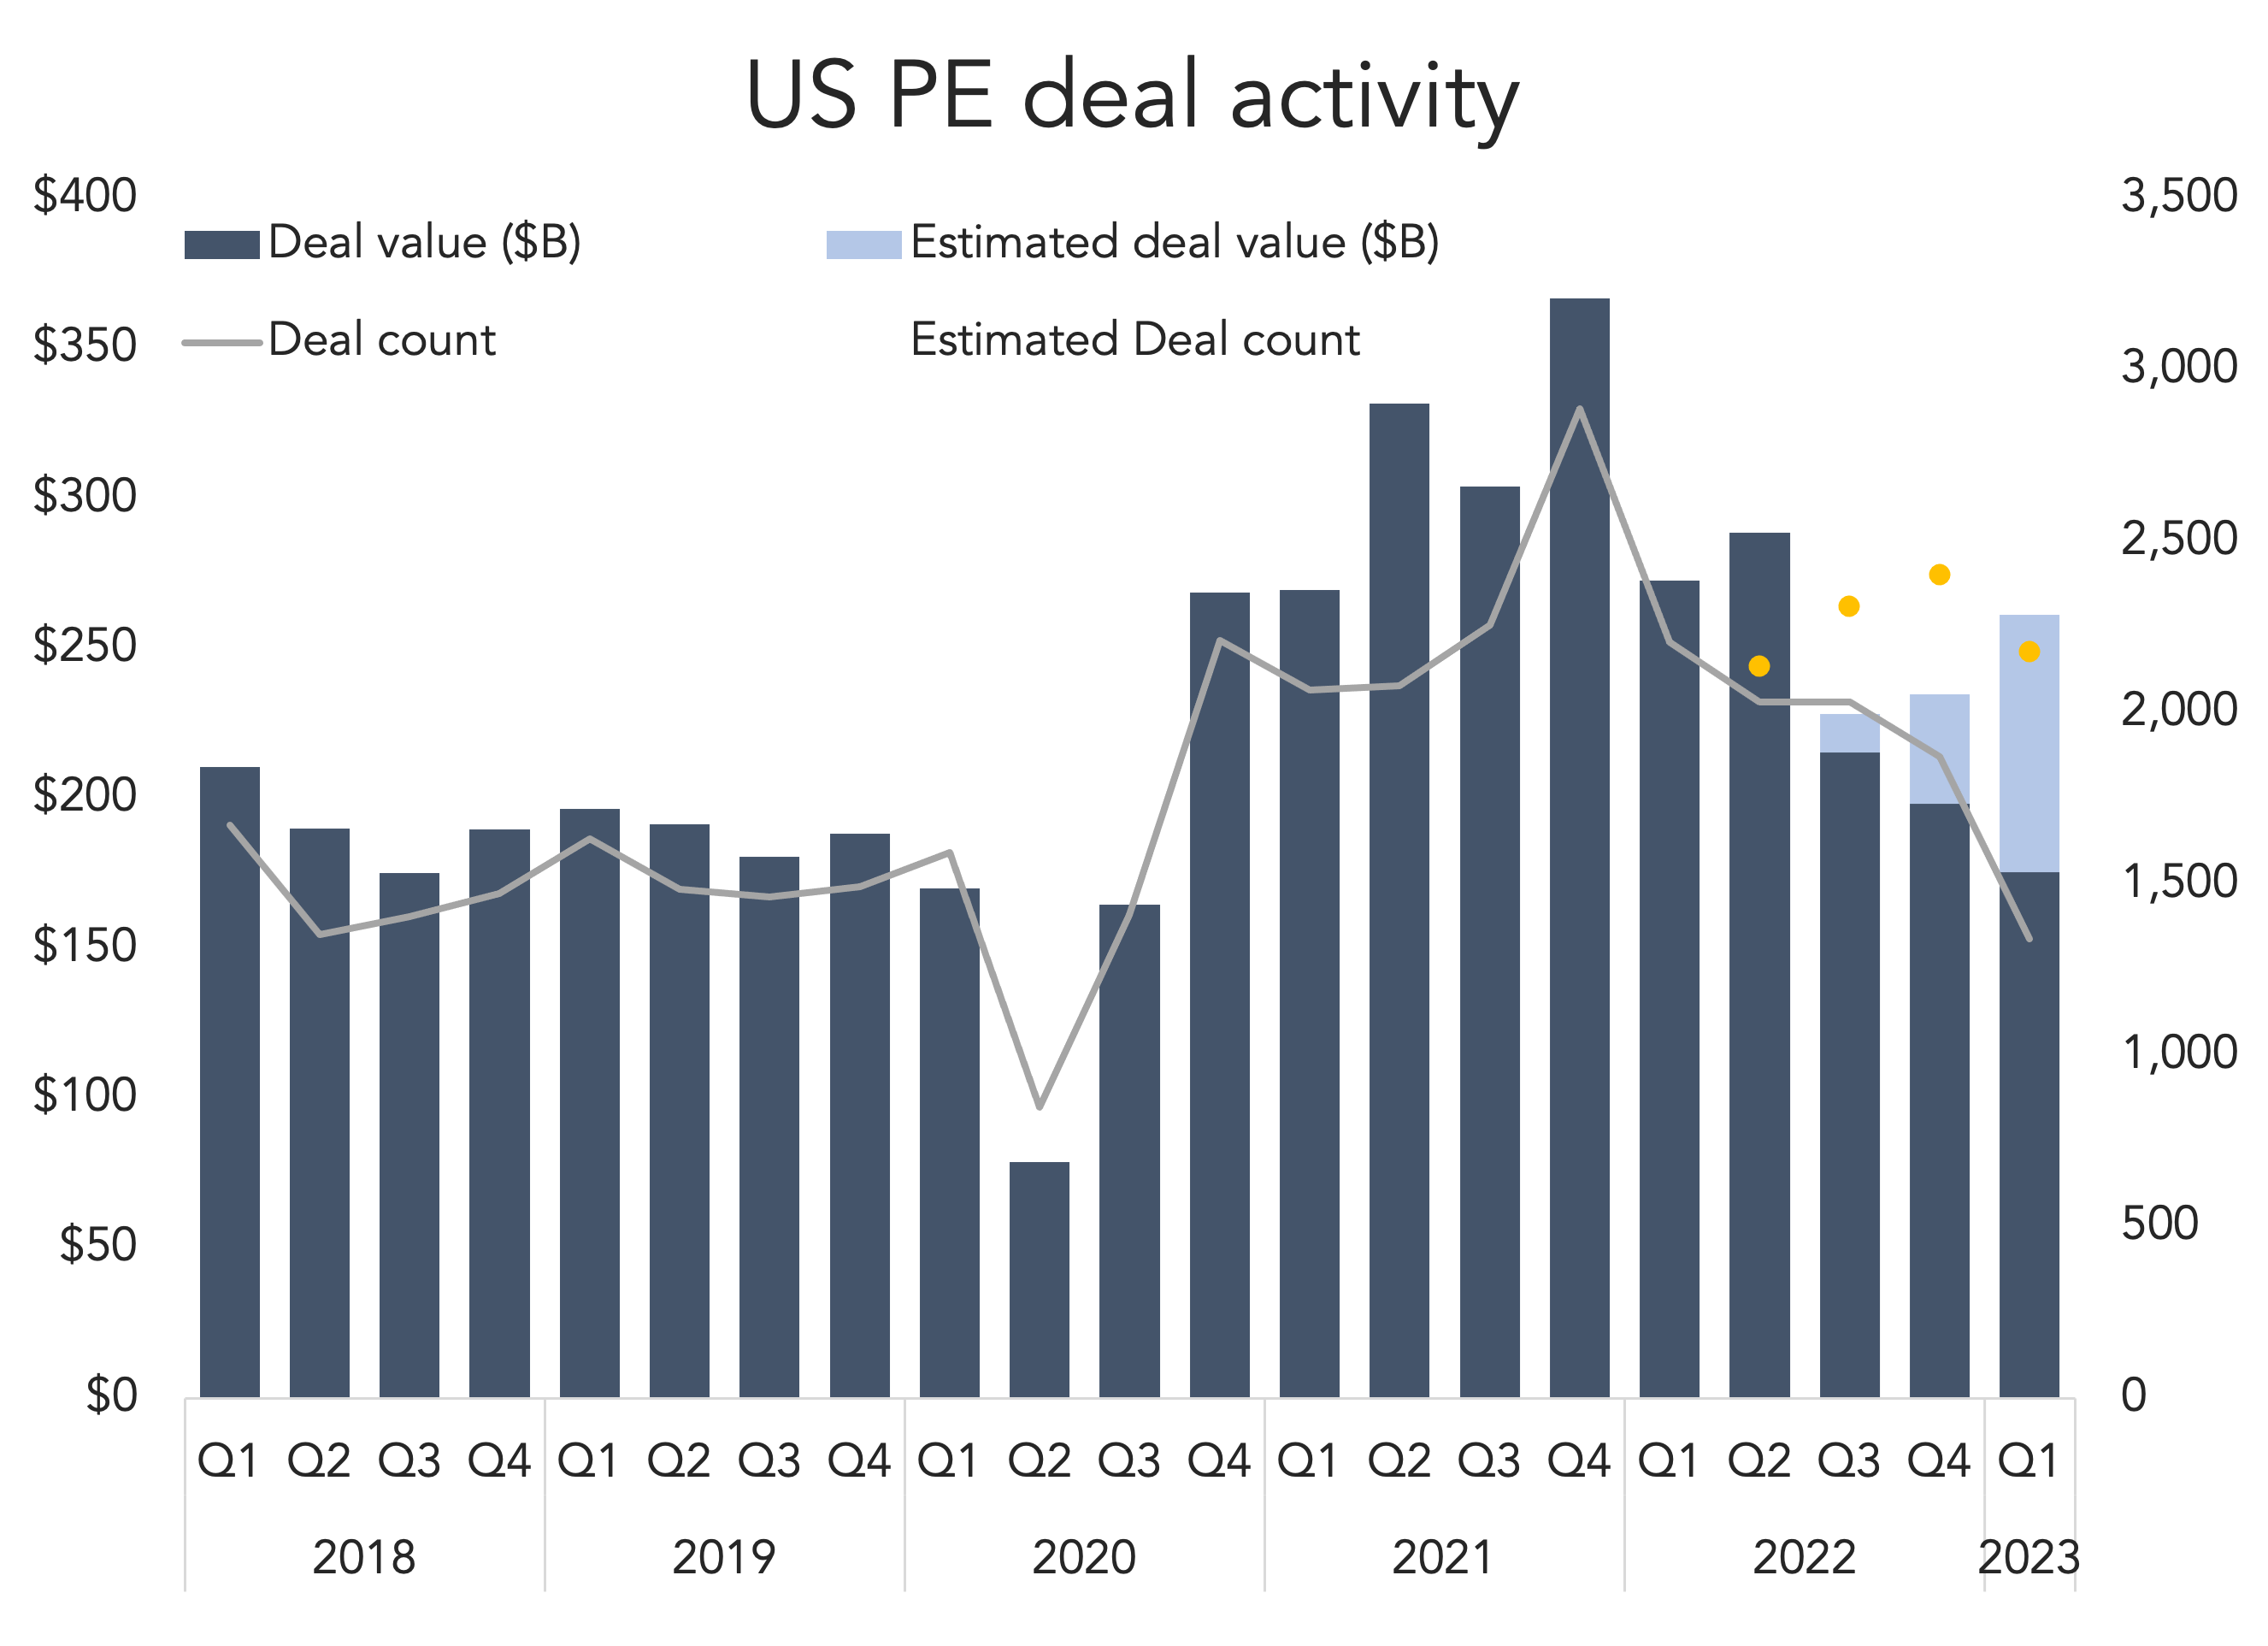
2023 started with mixed results. According to PitchBook’s just-released Q1 2023 US PE Breakdown, deal flow slid 9% while deal value rose about 11%. Both figures are ahead of pre-Covid levels, but post-Covid trends continue to decline. The median deal size is way down from 2021 highs, and is so far below 2022 levels as well. That gels with investor sentiment, which is leaning toward smaller deals amidst elevating interest rates and trickier financing options.
Exits, on the other hand, are not so mixed. Both exit count and value declined again in Q1, the third consecutive quarter of skimpier numbers. 279 sales were inked, worth a combined $55.8 billion. Both numbers are competitive with Q2 2020 statistics, when exit activity slowed to a crawl. Exits are especially muted in the SBO market, with only 74 sponsor-to-sponsor sales to start the year. Financing options are again to blame here, but could pick up going forward: SBOs “will likely soldier on through the rest of the year as PE firms seek opportunities to spend down their capital, albeit at smaller sizes.” But don’t be surprised to see another muffled quarter in Q2, as PE firms try to navigate a tougher financing environment while maintaining buyside discipline.
(Past performance is no guarantee of future results.)



Latest news

With inflation running hot, rate hike expectations strengthen
A hotter-than-expected inflation reading has renewed expectations for near-term Federal Reserve tightening. The Consumer Price Index rose 0.6% month-over-month, pushing…

Open Tab
Leveraged loans keep running up a tab. Senior direct lending already knows what it owes.
