



Download PitchBook’s Report here.
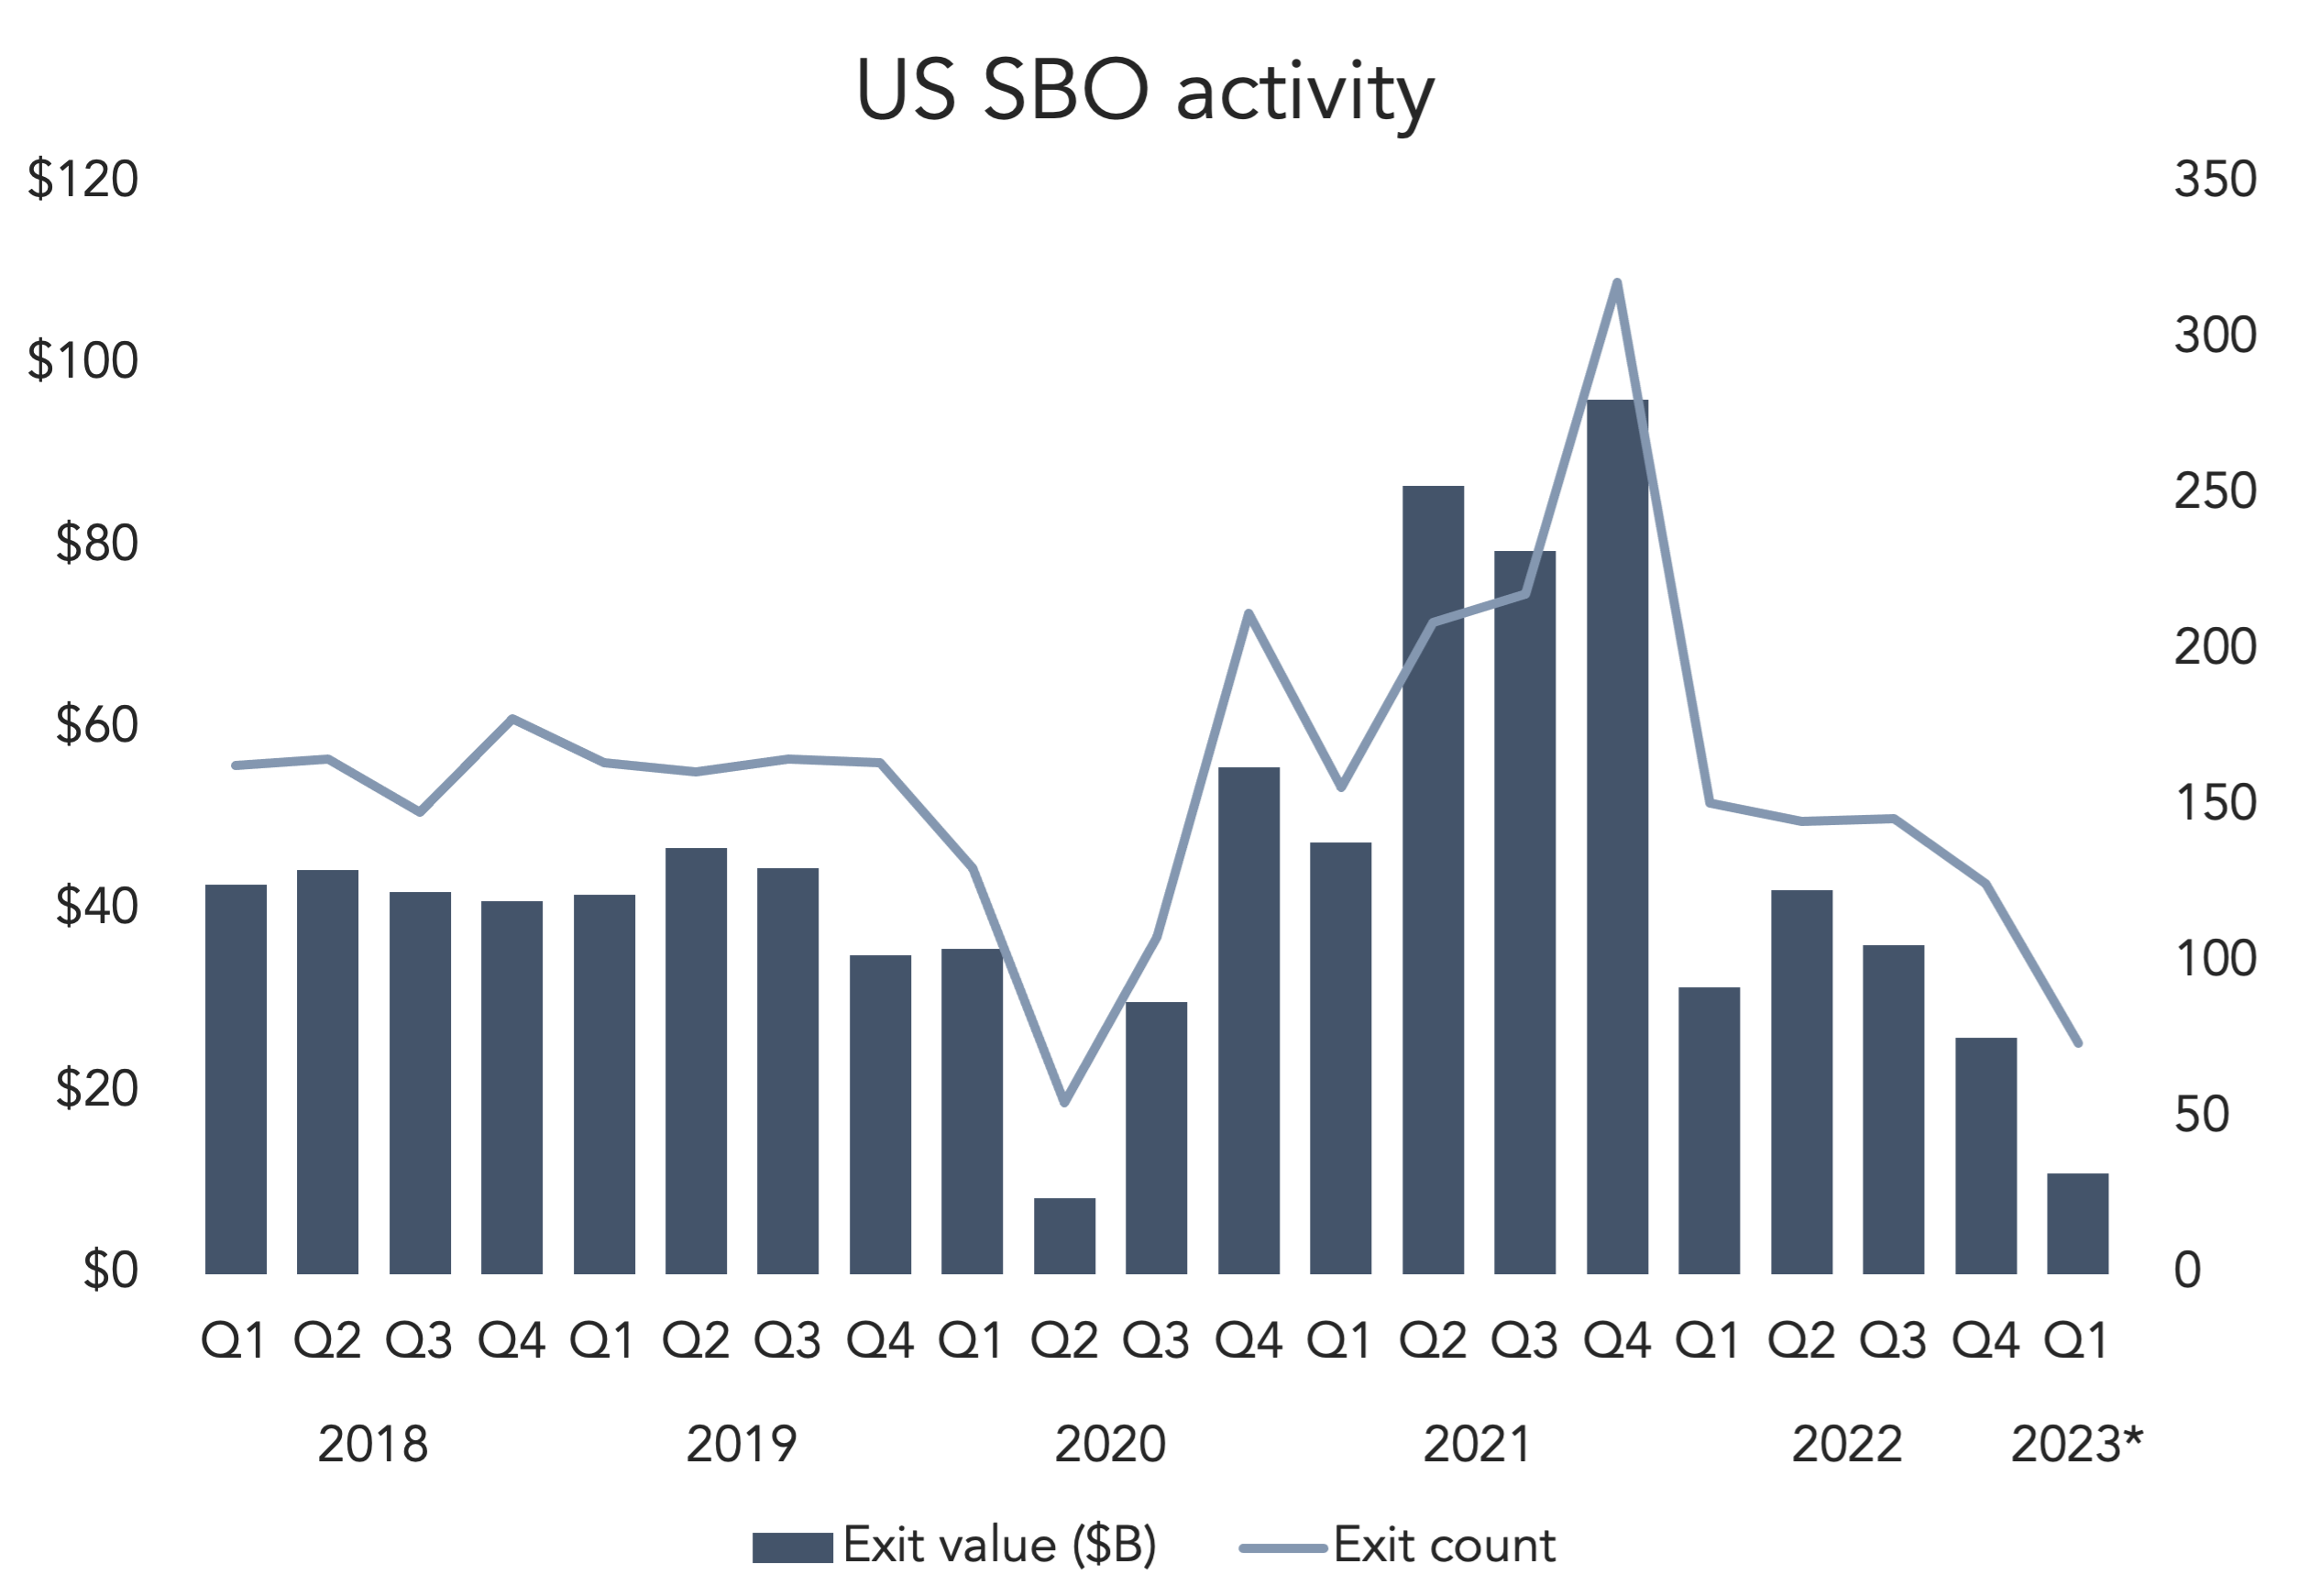
PE exits were historically slow in Q1, according to PitchBook’s Q1 2023 US PE Breakdown. All exit ramps—corporate acquisitions, IPOs and secondary buyouts—were down significantly. SBO activity has been in a teeter totter pattern since Covid. Q4 2021 saw 318 SBOs—the most ever recorded—but was bookended by historically low quarters in Q2 2020 and Q1 2023. The chart above shows how steady SBO activity was prior to Covid, but it’s been anything but since then.
PE buyers and sellers are both in cautious territory; sellers are hesitant to sell low while buyers are navigating higher financing costs and macro uncertainties. Pricing disagreements happen in those environments, and deals don’t get done as a result. The IPO window is effectively closed—only 4 PE-backed listings happened in Q1. The only game in town is corporate M&A, which was down in Q1 but relatively healthy compared to the other exit routes. With selling opportunities down across the board, sponsors are opting to hold onto portfolio companies for now, making more improvements and waiting for the weather to improve.
(Past performance is no guarantee of future results.)


Latest news

Share of PE middle-market deal count by backing type
Add-ons remain the workhorse for middle-market deployment, accounting for 67. 1% of all middle-market transactions YTD, in line with activity seen in recent years.

Software deal share falls in middle markets, rises in large caps
In Q3’26 software’s share of total deals fell in both the Lower Middle Market (to 7%) and Upper Middle Market (to 9%), while Large Cap saw a modest uptick in share to 8%.

Secondary loan prices stabilize following steep declines
Secondary loan prices came under significant pressure through September and October, with the Bloomberg U.S. Leveraged Loan Index declining 119…