



Download PitchBook’s Report here.
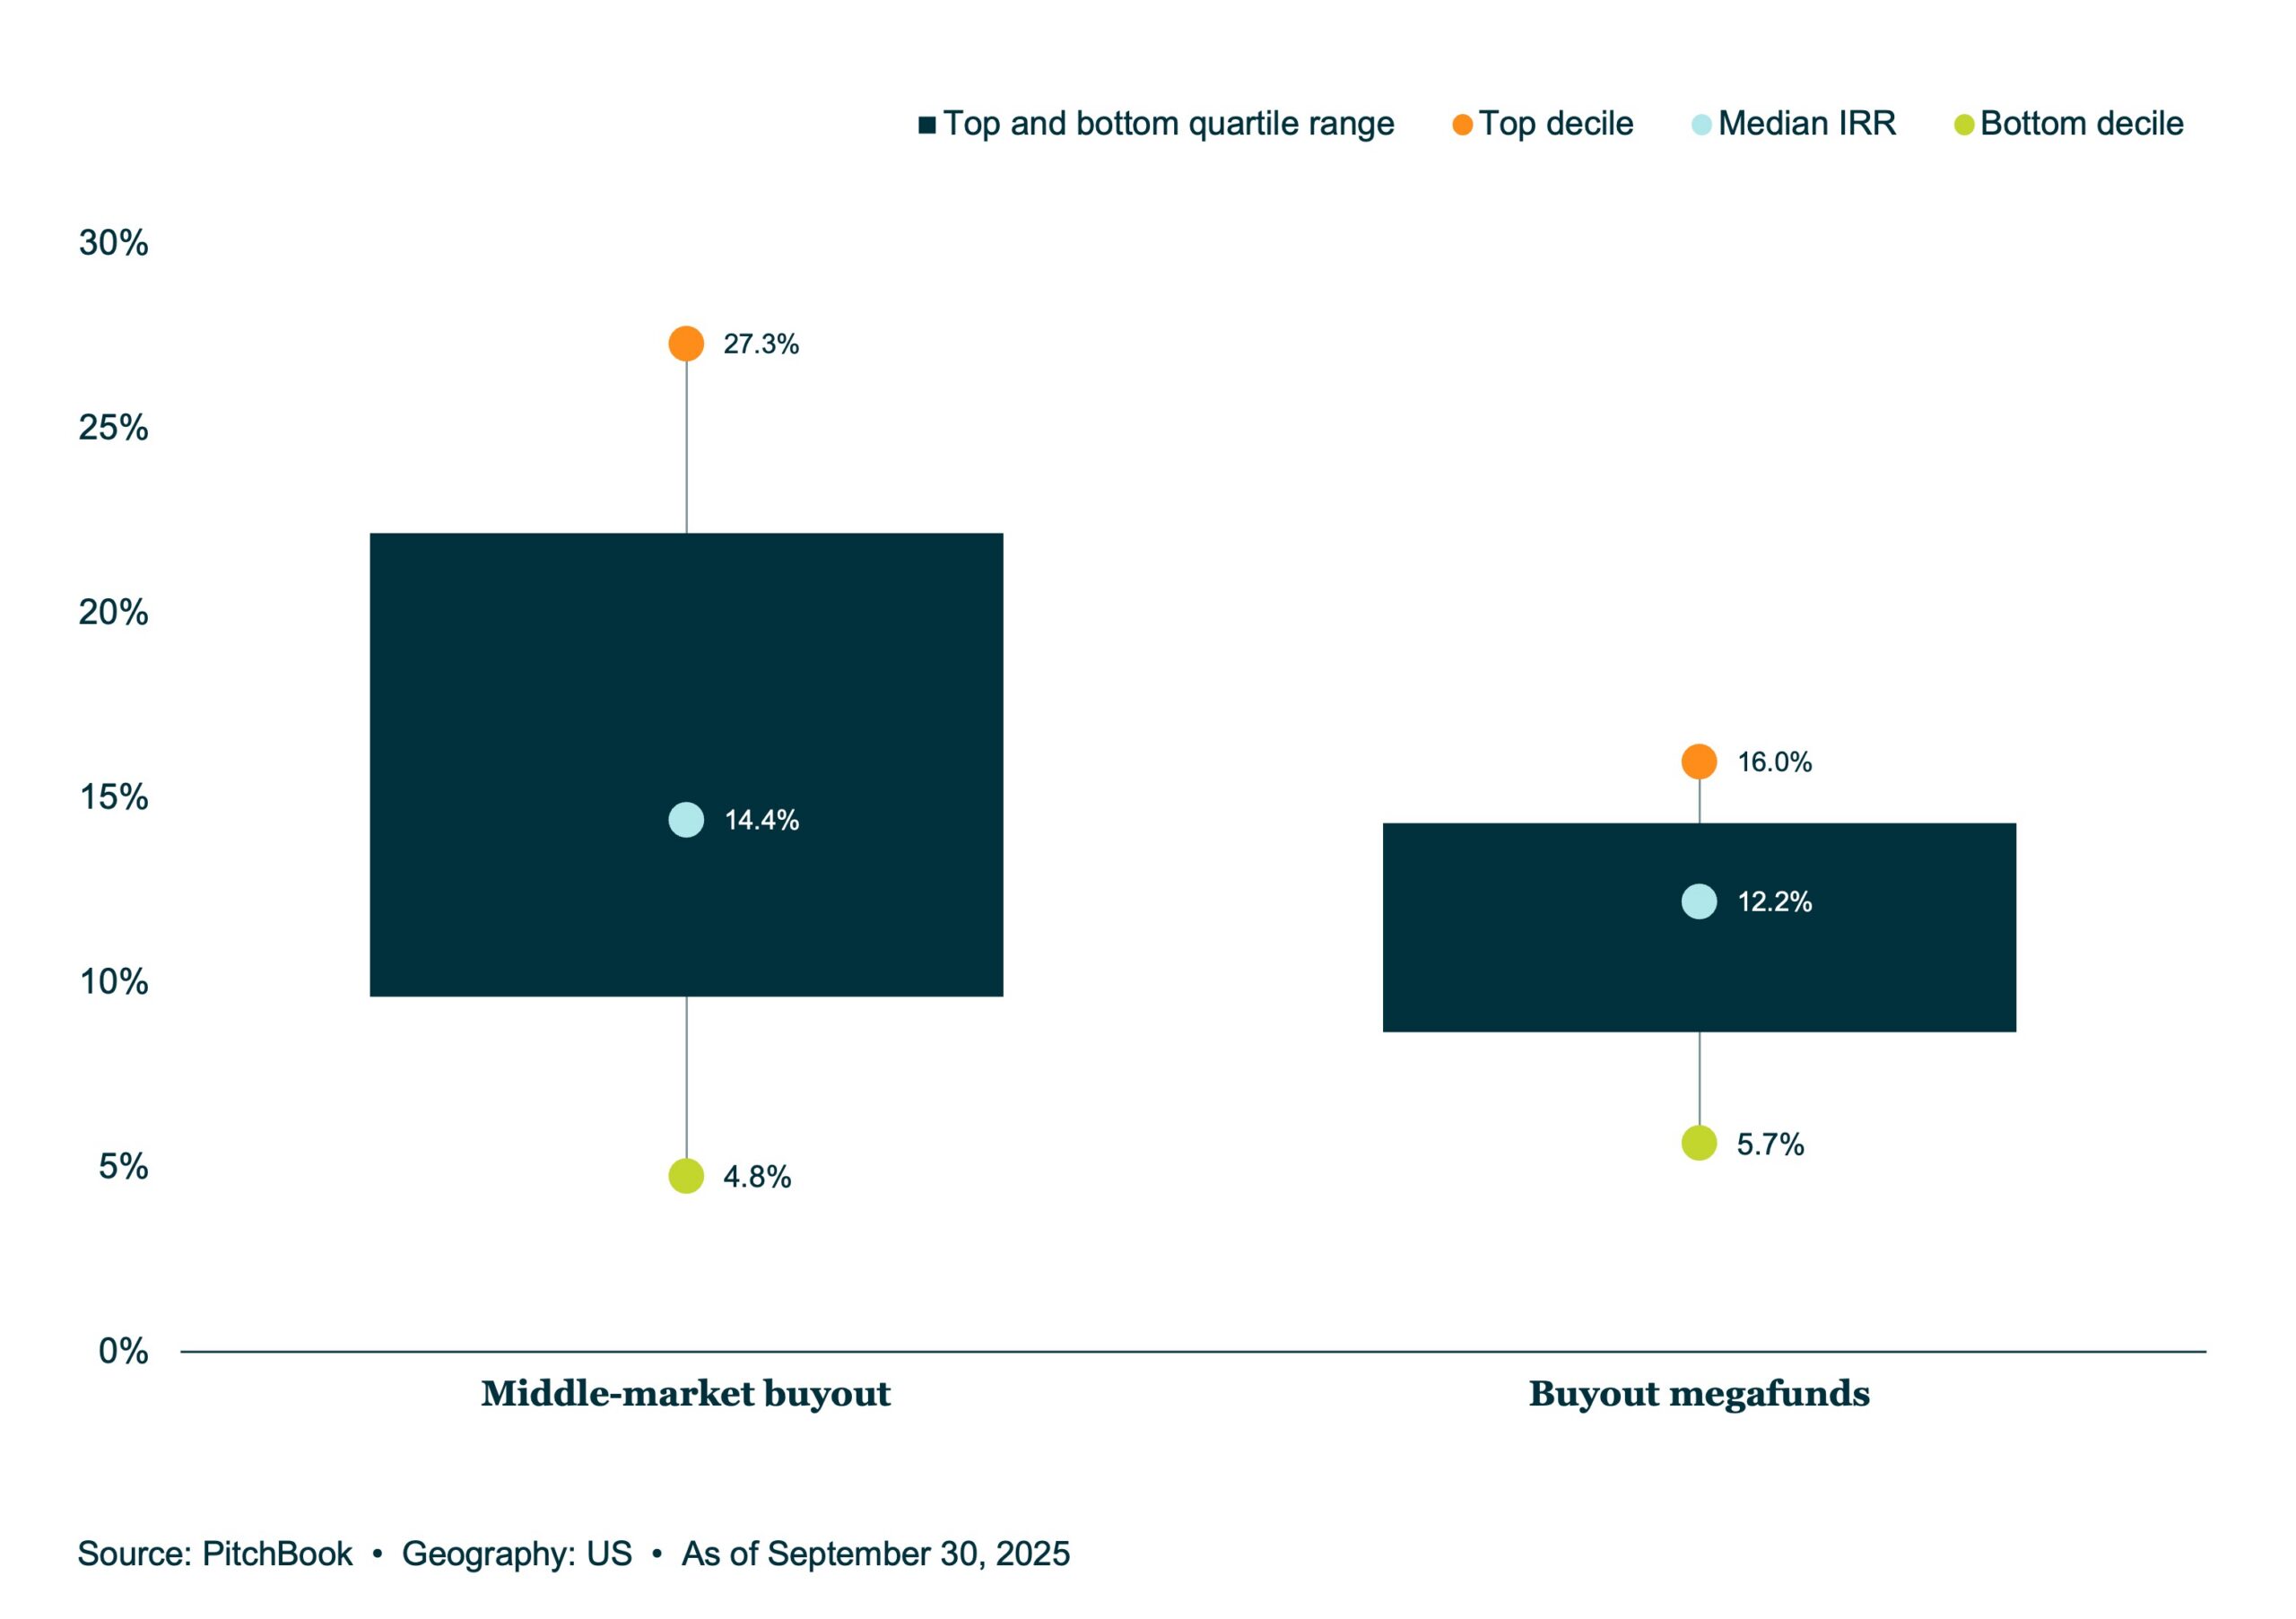
For much of the past two decades, PE delivered a consistent premium over public markets that justified its illiquidity and fee load—a proposition that is now under pressure. Long-term returns remain strong, with 10- and 20-year IRRs of 14.5% and 13.5%, respectively, but near-term figures tell a more sobering story: one- and three-year IRRs have moderated to 7.2% and 7.4%, reflecting the difficult vintage years that followed the rate-hike shock of 2022 and 2023. PE returns were as much a product of macro conditions as manager skill—cheap debt amplified buyout economics, rising multiples inflated exit values, and financial engineering did much of the heavy lifting. That era is over. Against that backdrop, the dispersion of returns across manager types has become an increasingly important part of the LP decision framework, and varies by manager type. Middle-market managers are leading on headline returns—their median, top-quartile, and top-decile IRRs are all leading those of megafund peers. However, megafunds consistently post higher bottom-quartile and bottom-decile returns than middle-market counterparts, suggesting that while peak upside is capped relative to the best smaller managers, the floor is also higher.
(Past performance is no guarantee of future results.)


Latest news

US leveraged loan launches reach five-month high in September
The US leveraged loan market recorded $93.6b of launches in September, marking the busiest month of primary market activity since…

Information technology topped nonaccruals on a cost basis
The information technology sector moved from second place in the first quarter to the top of the list in the second quarter
