



Like any good school year, this series went by fast. But unlike the end of the year, we’re not out for the summer. As class comes to an end, there’s one theme that’s been top of mind here at The Lead: “noise.” Looking back on how this year unfolded, it’s never been more important for investors, institutional and high net worth alike, to cut through it and focus on the facts and fundamentals.
Our goal with this series was to give you the tools to separate signal from noise, especially against headlines like Private Credit Defaults Are 1%, 6% or 19%, Depending Who You Ask – Bloomberg. As we’ve covered throughout the series, including in Different Numbers, Different Stories, and discussed with experts on our webinar, you don’t need to know the exact details. You just need a general understanding of what’s driving these numbers. For example, at the low-end of the range, that’s generally going to reflect “harder” measures of defaults such as missed payments, bankruptcies and distressed restructurings. Conversely, a higher rate is more likely to include items like maturity extensions, amended PIK, non-accruals and covenant trips. These measures can be a sign of stress, but that is not always the case. In fact, a recent Cliffwater research note puts some context around this. Of the PIK loans tracked, 40% eventually moved to non-accrual, but 30% returned to cash pay (see Chart). That’s exactly why these figures are worth reading alongside other measures, rather than in isolation.
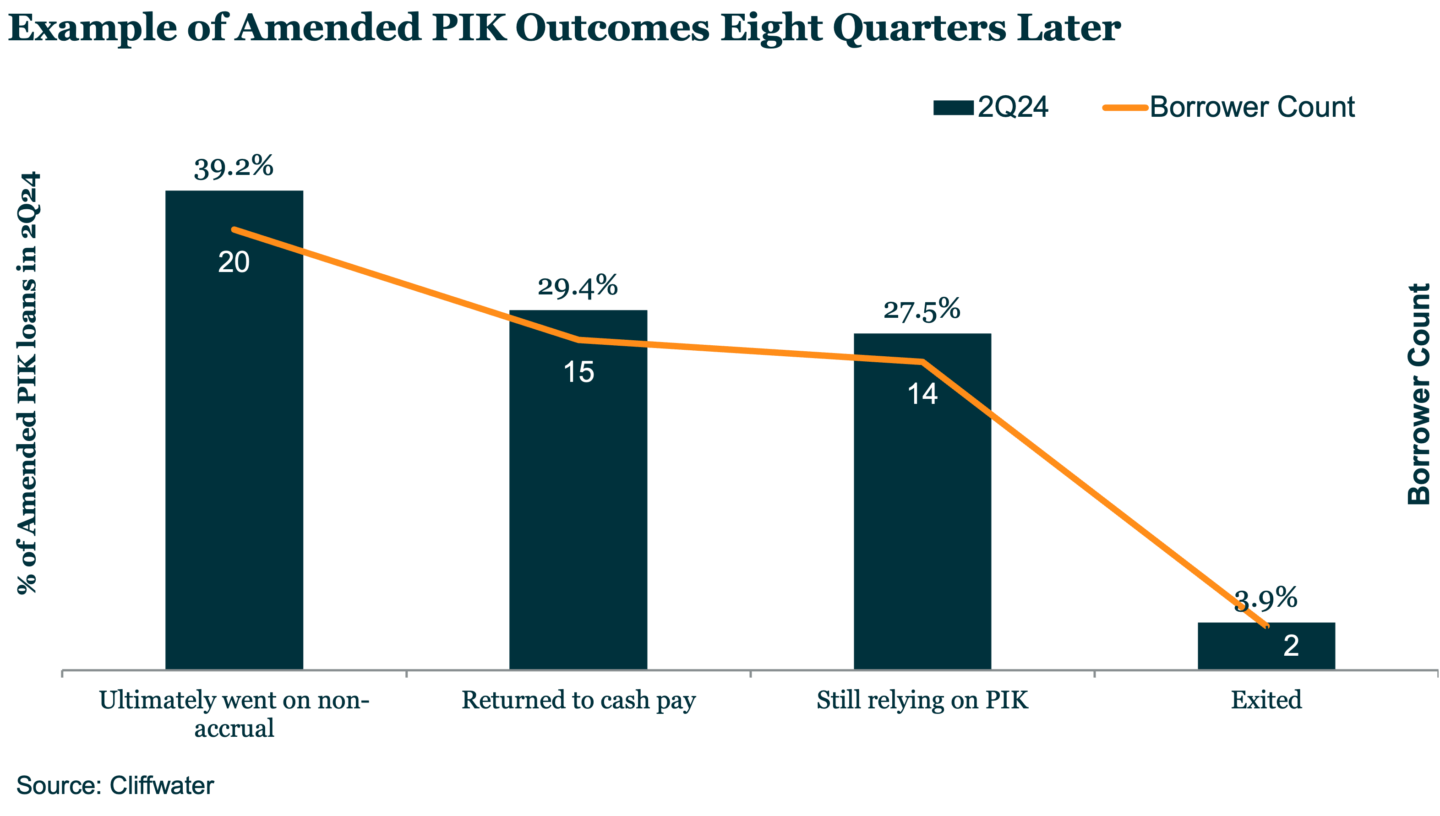
It’s also worth asking why that gap between hard and soft defaults has widened in the first place. Borrowers are still working through a genuine rate shock, with base rates moving from the zero lower bound to a Fed Funds rate near 4% today. Lenders have responded by extending maturities and, in some cases, preserving cash. But that rise hasn’t necessarily translated into losses, with the loss given default rate remaining around 1.1%.
None of this means we should ignore the pockets of stress discussed in Where Are We in the Credit Cycle? [Link] But history matters. When a headline cites a record-high default rate, how long has it actually been measured? In several cases, the data only goes back to 2024 – not even a full cycle. Measured against a longer lookback, many of these rates are simply migrating back toward their long-term average. In short, this is a normalization of the credit cycle, not a deterioration.
Going forward, we’ll keep watching how these softer credit events evolve, alongside other indicators like loans marked below 80, PIK loans marked below 90, and interest coverage ratios under 1x.
Noise will always be part of this market. The difference now is you know which signals are worth tuning into, because you understand how a default gets defined, how to read a rate and what’s driving it, how a recovery determines what you actually lose, and how it all ties back to where we sit in the cycle.
As promised, there’s no pop quiz, no final exam. Thanks for attending class this semester. We’ll see you in 201.



Latest news

PIK Your Next Adventure
Every amended PIK loan hits the same crossroad. Not everyone ends up at the same destination.

Top 50 BDCs Accounted for 75% of Nonaccrual Loan Cost in Q2’26
The 50 largest BDCs, on the basis of total debt investments as of the second quarter of 2026, accounted for 75% of the total aggregate reported value of nonaccrual debt at cost and fair value.

US private debt AUM ($B) by channel
In 2025 and the early part of 2026, the retail channel added AUM to the asset class at a much faster rate than institutional investors in both regions, with growth rates of 43.7% globally, 41.4% in the US, and 73. 1% in Europe through the beginning of 2026 compared with year-end 2024 figures.