Download PitchBook’s Report here.
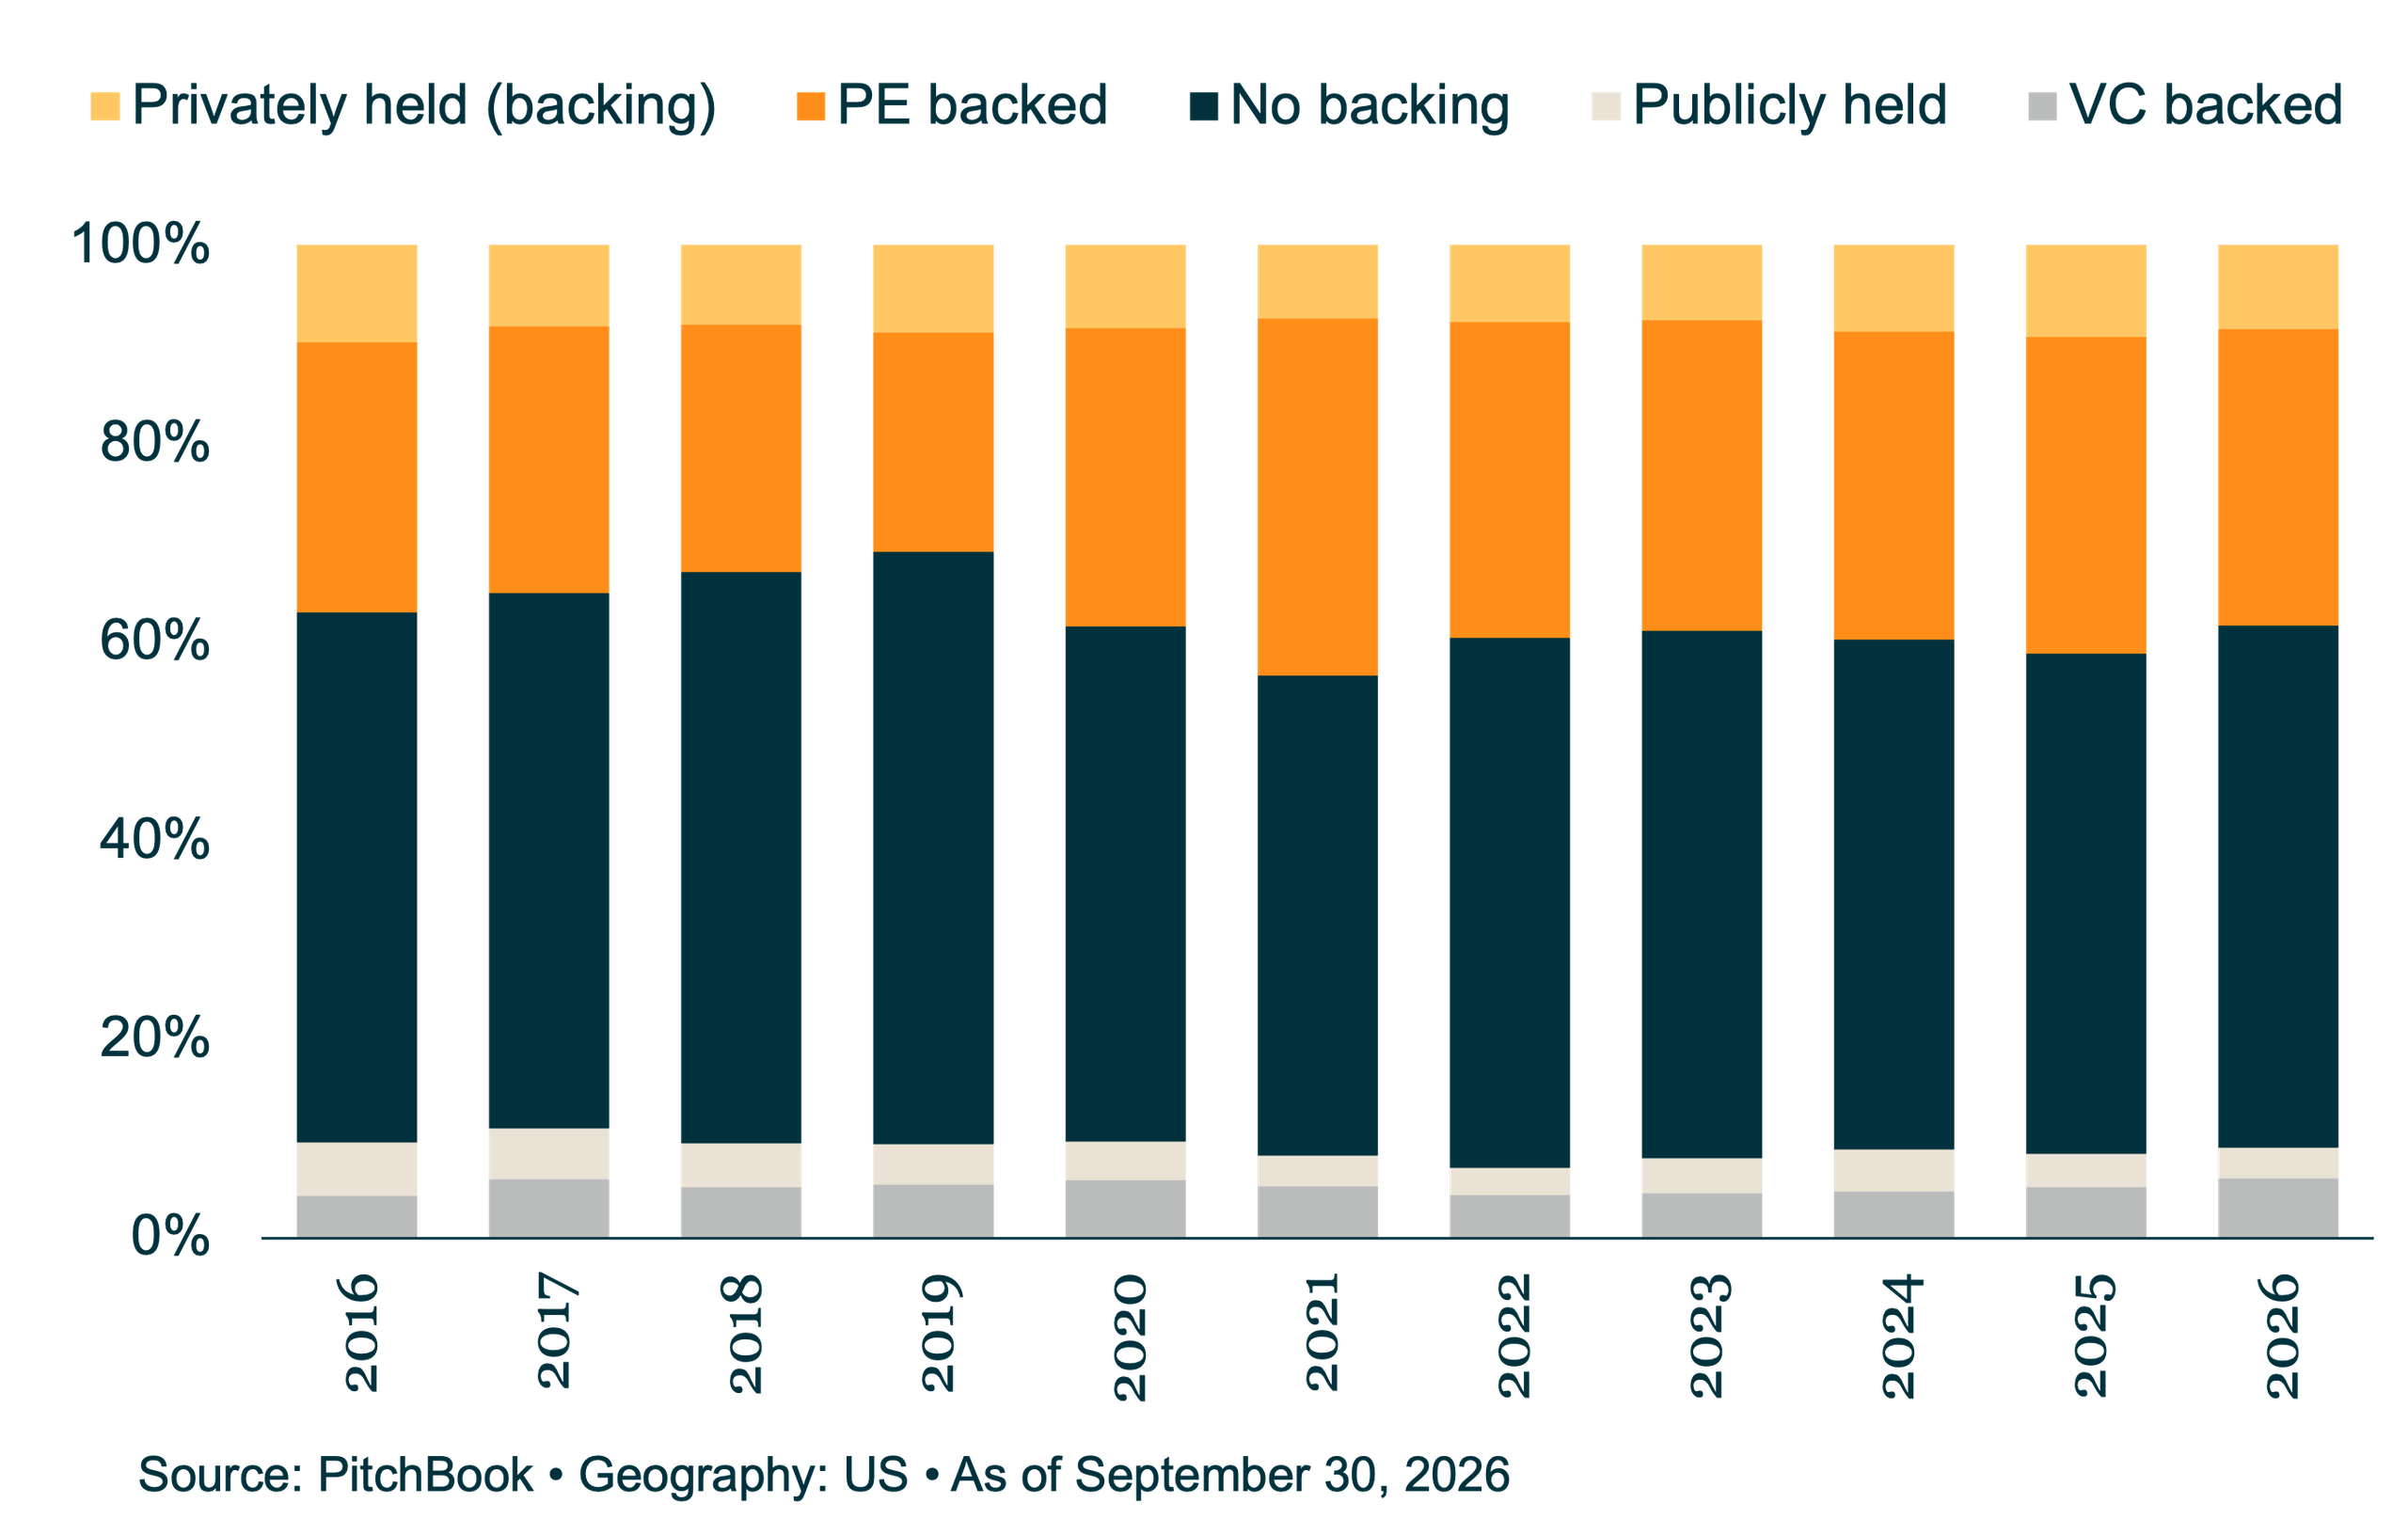
Add-ons remain the workhorse for middle-market deployment, accounting for 67. 1% of all middle-market transactions YTD, in line with activity seen in recent years. Middle-market add-ons have accounted for 44.8% of all US PE buyout transactions YTD, well above the 10-year average of 41.9%. Add-ons have also increased sequentially, inching closer to 600 in Q3. The roll-up machine continues to gain traction as sponsors home in on this deal type. As a result, add-ons’ share of total buyout deal value jumped to 17.4% through the end of Q3, up from 13.3% in 2025.Amid the concentration of activity in the middle market, founder-owned businesses continue to be the largest source of deal activity for sponsors, accounting for 52.6% of middle-market deals YTD, the segment’s highest level since 2023.The universe of founder-owned businesses in the US is massive, with a company count in the millions. Founder-owned businesses allow sponsors to pull the most growth levers and are often where sponsors default to in more tumultuous market environments. The next-largest bucket for deal activity is other PE-backed companies (sponsor-to-sponsor acquisitions), which have accounted for 29.9% of middle-market deal flow this year, right in line with historical averages.


Latest news

Software deal share falls in middle markets, rises in large caps
In Q3’26 software’s share of total deals fell in both the Lower Middle Market (to 7%) and Upper Middle Market (to 9%), while Large Cap saw a modest uptick in share to 8%.

Secondary loan prices stabilize following steep declines
Secondary loan prices came under significant pressure through September and October, with the Bloomberg U.S. Leveraged Loan Index declining 119…