


Markit Recap – 9/19/2016

Having the distinction of being the widest constituent in the Markit iTraxx Europe is clearly one that most companies would prefer not to have. Yet Glencore has held this dubious honour since the last index roll in March and beyond. It had a challenger in fellow miner Anglo American, but Anglo’s downgrade to junk and consequent removal from the investment grade index left the field open to the Swiss firm.
Glencore’s current CDS 5-year spread of 227bps has an implied rating of ‘B’, suggesting that its membership of the index is also precarious. But this single fact obscures what has been a remarkable credit story. In January of this year, Glencore was trading in excess of 1,100 bps, firmly in distressed territory and an incredible level for an investment grade credit. Since then it has tightened by more than 900bps, comfortably the best performance in the investment grade universe.
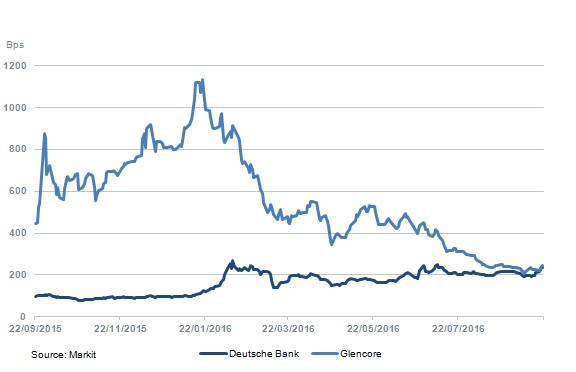
Some would say that this is evidence that the CDS market is prone to overshooting. But this ignores the fact that Glencore’s fundamentals have changed significantly during the period of spread tightening. The company has reduced net debt from €30bn in the middle of last year to $23.6bn at June 30, mainly through selling assets, cutting capacity and suspending dividend payments. It aims to cut new debt to $16.5bn to $17.5bn by the end of the year. Glencore has also benefitted from the recovery in natural resource prices, though this has been partially offset by a prudent hedging policy.
So the movement in Glencore’s CDS spread can be justified by the change in the firm’s financial strategy, as well as a shifting outlook in its core energy markets. Liquidity was not an issue – Glencore was heavily traded during its difficult period and regularly ranks in the top 10 most active corporate names. The company’s share price rose above £2 a share for the first time since August 2015 from a low of 69bp in January, demonstrating that the credit deterioration was not an anomaly.
Can the same be said for Deutsche Bank? The German institution is the latest contender to take the “top” spot it in the Markit iTraxx Europe. Its spreads hit 237bps on September 20, just 5bps tighter than Glencore. This was the roll day, so it was expected that spreads would widen. But Deutsche’s CDS was trading at just 95bp at the beginning of this year, while the Markit iTraxx Senior Financials index widened from 77bps to 100bps over the same period, so it is clear that the German bank is underperforming its peers. Like Glencore, there is a solid explanation why the CDS market has reacted in such a manner. Deutsche was hit by a $14bn fine this week from the US Department of Justice, though there are reasons to believe that the final figure will be lower.
But the real reason behind the credit deterioration – and why its stock is trading at a fraction of book value – is the perception that the bank is undercapitalised. In particular, its leverage ratio of 2.68% is lower than all of the world’s major banks, according to the FDIC. On a risk-weighted basis the capital picture may look different, but the markets focus on the more transparent measure, so it is little surprise to see a risk premium on Deutsche. Another bout of negative new flow in the coming weeks could see Deutsche take Glencore’s crown.
Contact: Gavan Nolan
Gavan.Nolan@ihsmarkit.com







Private Credit Defaults 101: Back to School
As Labor Day approaches, the unofficial end of summer is upon us. But, before we get too sad, there is also the familiar back-to-school energy.