



After publication last week, we were concerned we had been a bit rough on our bank friends in dismissing the ability of regulated institutions to adapt as readily as CLO’s when loans became troubled.
An informal survey of those friends revealed that, if anything, we had been too generous.
“You were spot on with your comments,” one long-time loan syndication head told us. “The fact is that banks do fine with double-B and high single-B credits, but our ability to ride through difficulties with lower credit quality assets is extremely limited.”
“Banks just don’t have a lot of flexibility in terms of managing longer-term portfolio problems,” the work-out chief of a regional bank remarked. “To optimize recovery value in a work-out situation,” he went on, “you sometimes have to convert debt to equity. That’s tough to do on a bank balance sheet, but in a CLO, it’s done all the time.”
A money-center banker added, “Once a loan goes to work-out, other factors come into play. Relationship considerations with the sponsor at a local level may get trumped by senior management just wanting to get out of a bad loan. Patience wears thin quickly for a criticized asset.”
That’s not to say that CLO managers don’t have to worry about bad loans. Since the establishment of these vehicles in the early 1990’s, a healthy set of standard covenants have protected investors. For example, so-called overcollateralization, or OC, tests measure the cushion between the values of the portfolio loans (assets) vs. the outstanding classes of liabilities.
Another trigger is a limit to triple-C loans the CLO can carry at any one time. Defaulted loans as a percent of the total portfolio represents a third guard rail. Other metrics include interest coverage, assets purchased at a discount, and PIK loans.
As anyone who has managed a CLO can attest, keeping track of not only the vehicle’s historic performance against these benchmarks, but pro forma against loans to be booked, requires sophisticated risk management by experienced hands.
But all things being equal, the alignment of interests among principals in a CLO and more flexible vehicles often give managers more time and tools to optimize value.
With the US CLO market now over $300 billion, structures have adapted once again; per the Volcker Rule, the next generation (3.0) of CLO’s can hold no bonds.
And despite all the hoopla about the nearly $4 billion in outflows from retail funds this quarter, the CLO market has issued almost double that in loan capacity for June alone – and the month not yet over.
This highlights our thesis that there will always be participants prepared to fill the demand side of the loan equation.
Next week: why middle market CLO’s offer great value for investors and issuers.



Latest news

PIK Your Next Adventure
Every amended PIK loan hits the same crossroad. Not everyone ends up at the same destination.
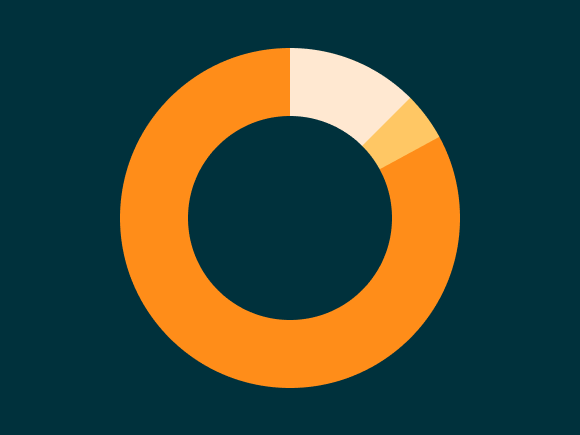
Top 50 BDCs Accounted for 75% of Nonaccrual Loan Cost in Q2’26
The 50 largest BDCs, on the basis of total debt investments as of the second quarter of 2026, accounted for 75% of the total aggregate reported value of nonaccrual debt at cost and fair value.
Private Credit Defaults 101: Beyond the Noise
Like any good school year, this series went by fast. As class comes to an end, there’s one theme that’s been top of mind here at The Lead: “noise.”