


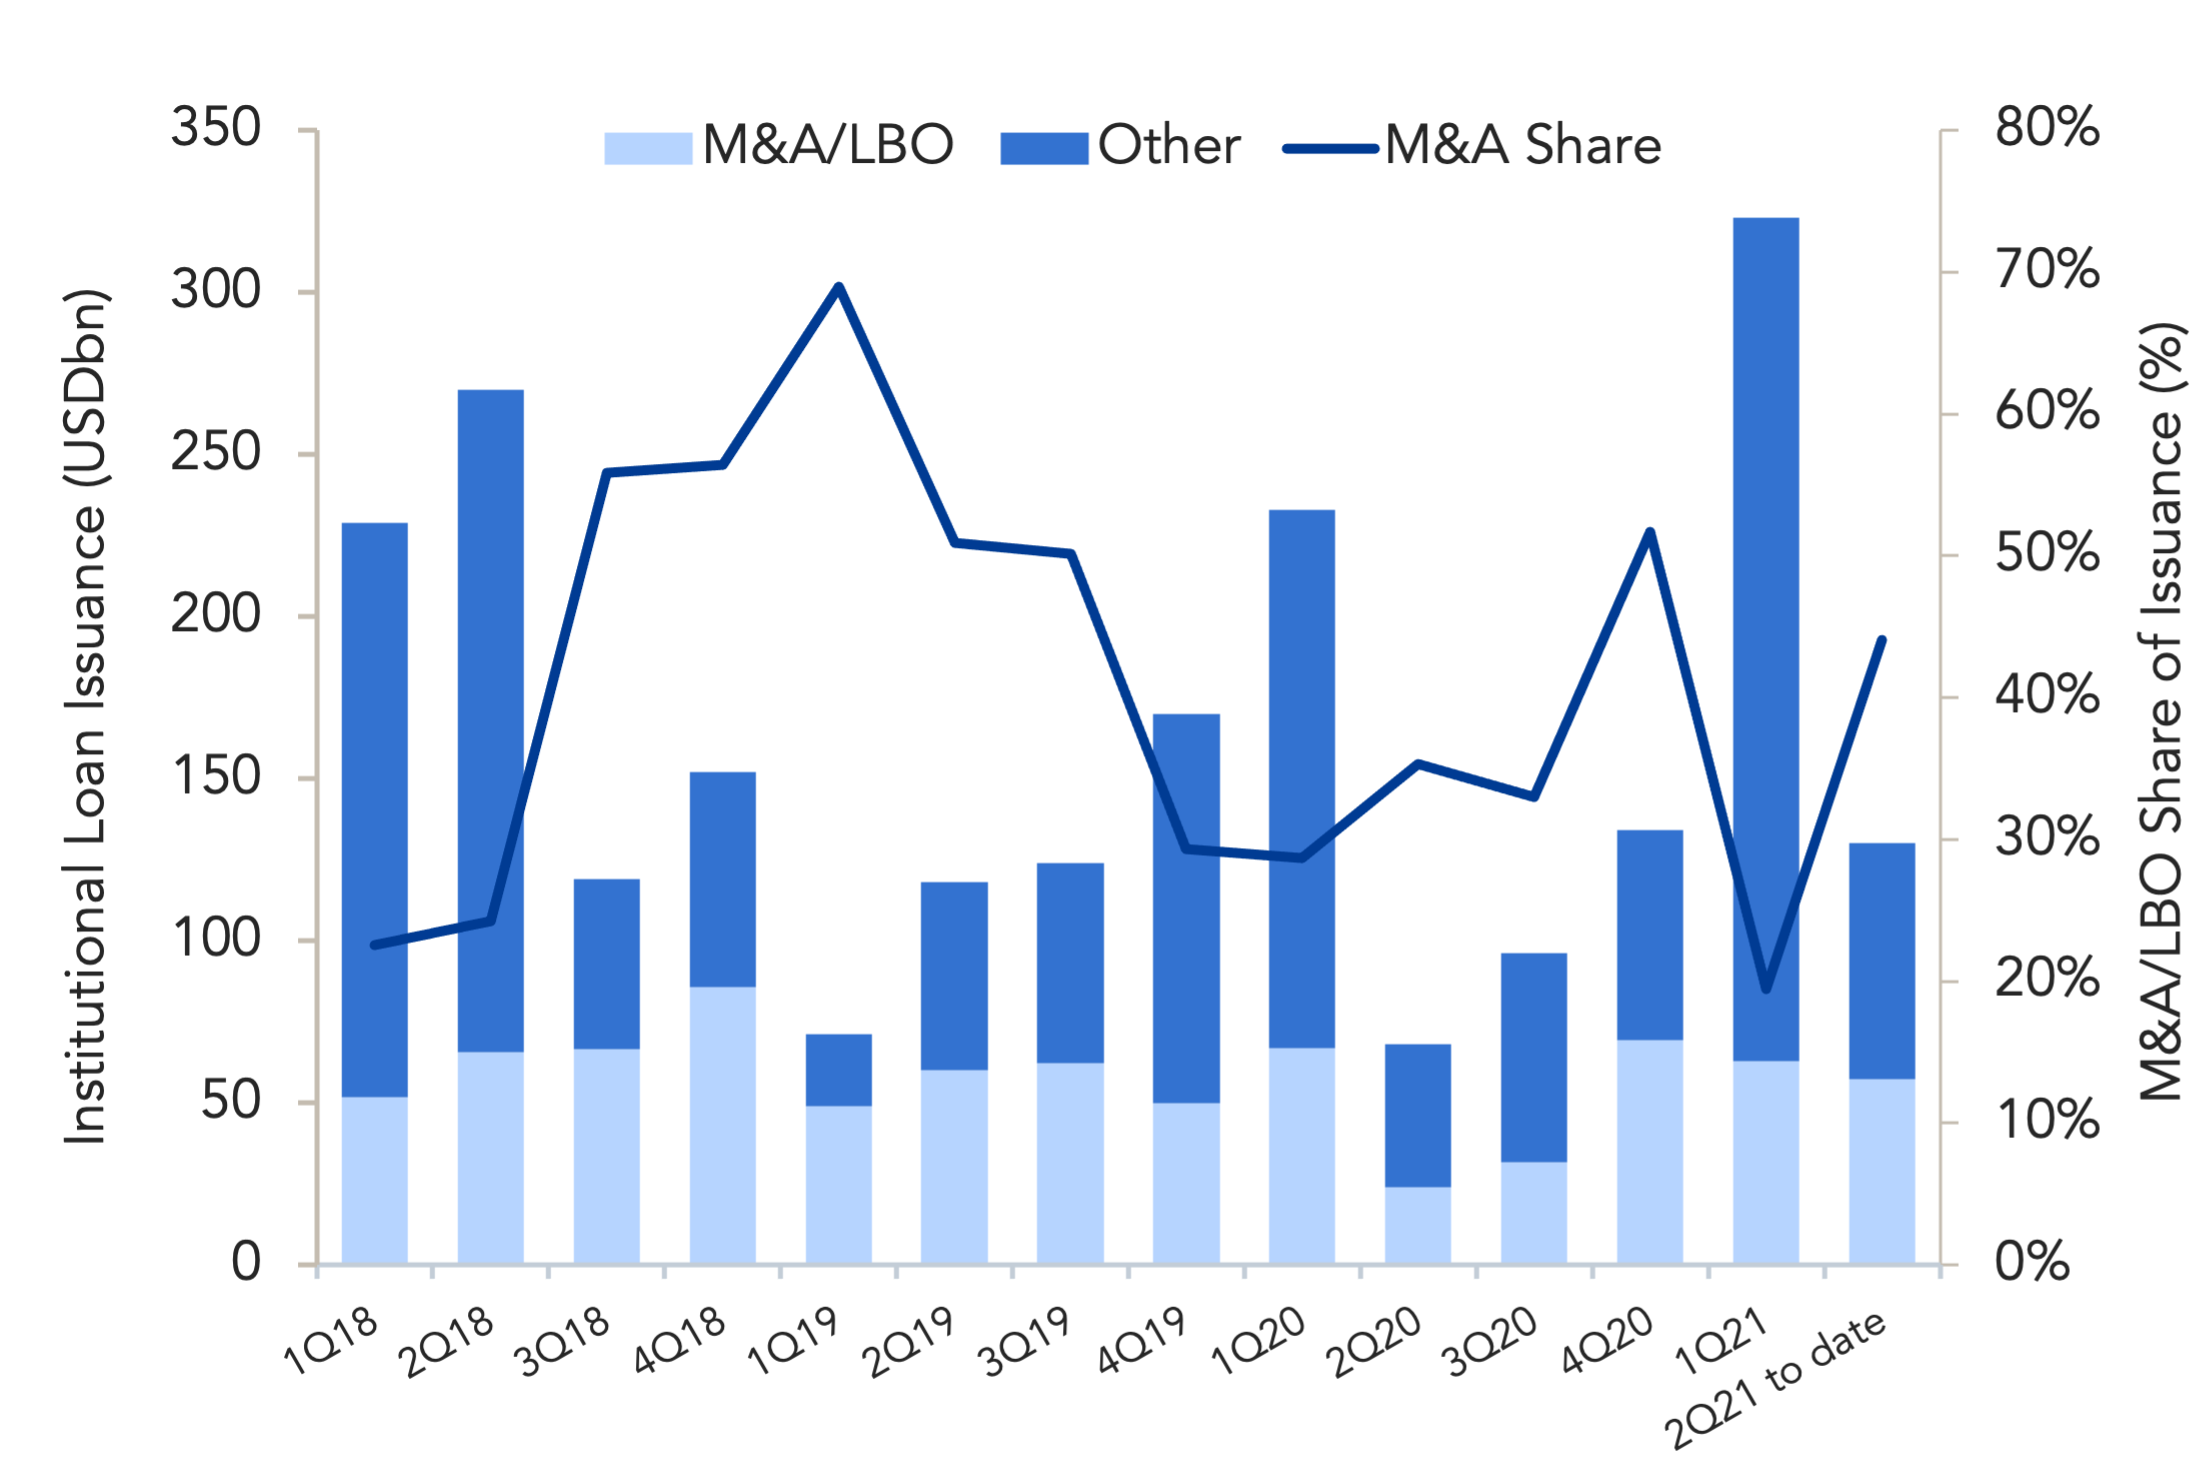
Quarterly M&A/LBO share of institutional loan issuance improves in 2Q21 to-date

Source: Debtwire Par
Institutional loans backing M&A and buyout activity have totalled USD 120.1bn this year to date, improving from just USD 78.7bn at this point last year as the coronavirus pandemic (COVID-19) largely kept the pipeline for buyout and acquisition financings closed. At USD 57.3bn through May, the 2Q21 figure looks set to surpass the 1Q21 total of USD 62.8bn.
May M&A/LBO issuance, at just USD 20.1bn, represents a significant shortfall from the USD 37.2bn surge in issuance in April, though that level of activity is an outlier that has not been matched since October 2018.
Pent up demand has no doubt contributed to the acquisition uptick, as refinancings dominated the loan market in the first quarter. Even as M&A/LBO activity improved from 2020 levels, a wave of loan repricings and refinancings pushed the share of M&A/LBO issuance down to just 19% of total leveraged loan issuance. So far this quarter that picture has improved, with April M&A issuance helping to push the quarterly share to 44% to-date.
Driving acquisition and buyout activity this year are technology sector borrowers, who have tapped the institutional loan market for approximately USD 22bn to-date, followed by industrials and chemicals (USD 21.2bn) and business services (USD 20.6bn) issuers. As expected, all are exceeding 2020 issuance levels, however all three sectors remain below their respective 2019 volumes.
Looking at individual deals, it was CoreLogic’s USD 3.75bn LBO financing that drove tech volume higher in April, followed by RealPage’s USD 3bn buyout loan completed in April, and more recently, Jazz Pharmaceuticals‘ USD 6.5bn financing backing its acquisition of GW Pharmaceuticals.
(Past performance is no guarantee of future results.)




Latest news

US leveraged loans returns turn negative in October
The Bloomberg US Leveraged Loan Index (Ticker: LOAN) has returned -0.26% this month through October 21, reducing its year-to-date return…

M&A activity begins to tick upward
In the third quarter of 2026, acquisition-linked loan volume across North America and Europe reached about $47 billion, up from $30.6 billion in Q2 and $29.5 billion a year ago.
