



The driving force behind such an explosion in repricing deals is demand for new paper, which is currently outstripping the offer. While issuers remain cautious about coming to market for new money, they are using this opportunity to slash their interest expenses.
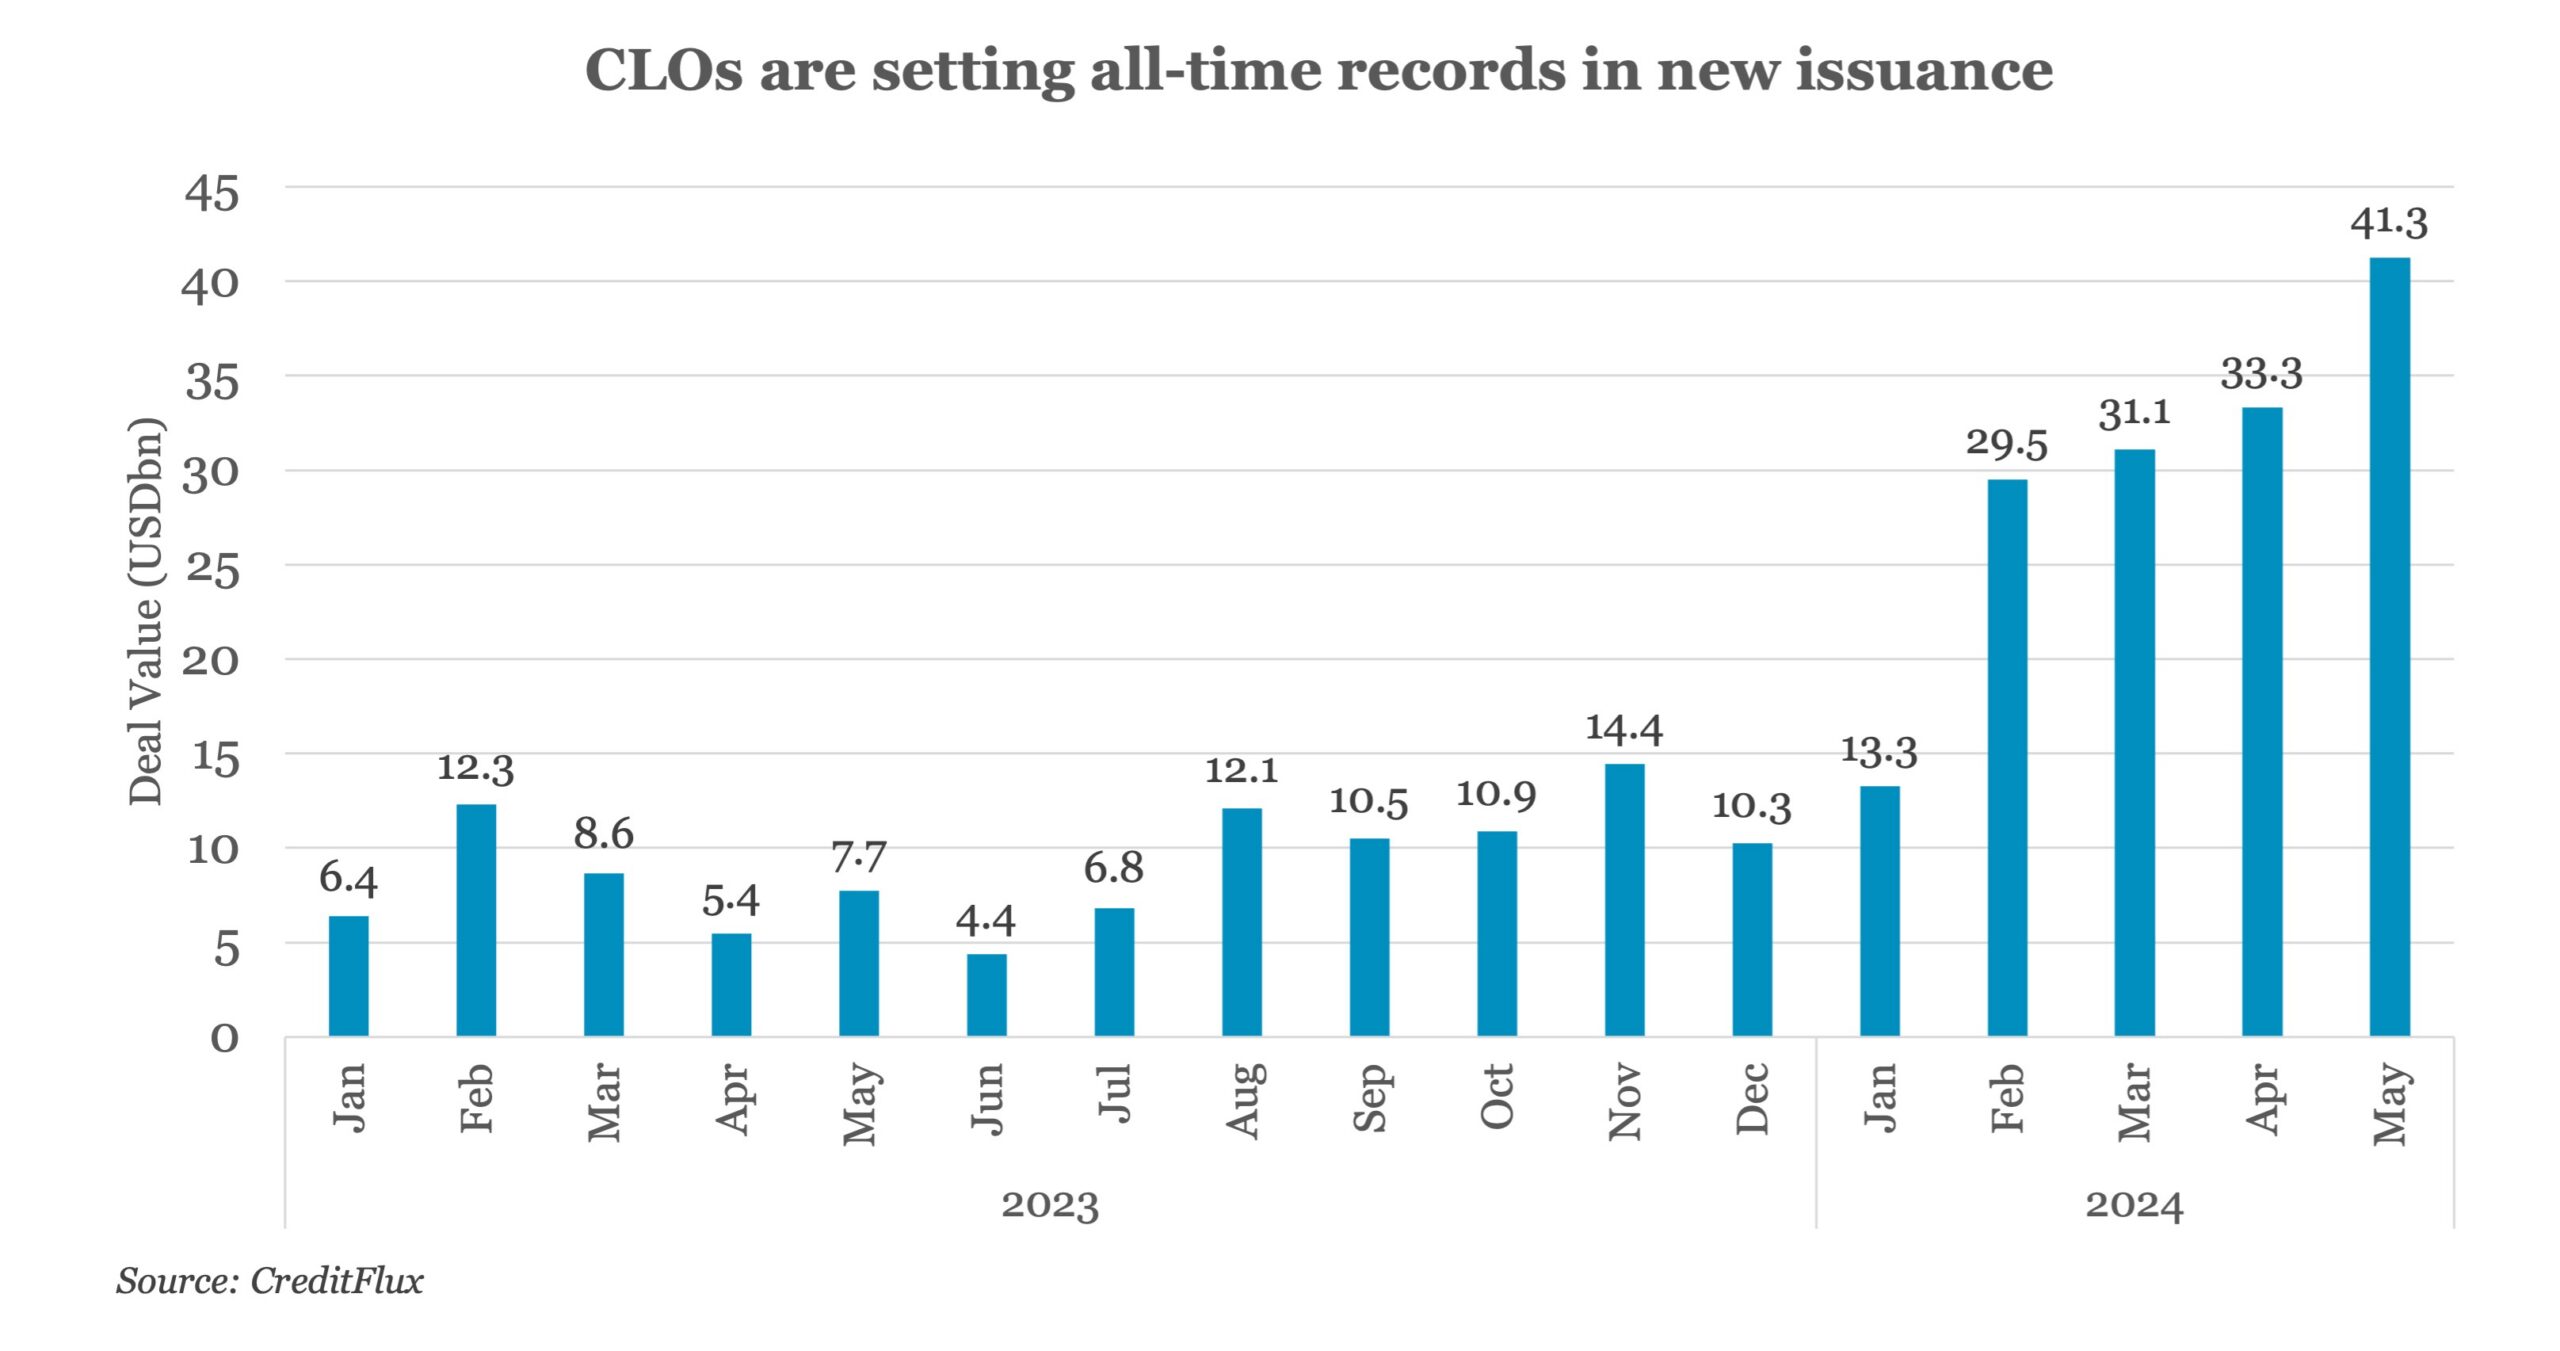
The question is why is there such a marked disparity between demand and supply? In February, collateralized loan obligation (CLO) issuance more than doubled from January to USD 29.5bn, a new record amount for monthly issuance. Volumes continued to soar in March and April, peaking at USD 41.3bn in May. Although around half of this historic high has been reset and refinancing deals, new money alone reached USD 19.3bn in May, hitherto unseen before on the CLO market.
Investor appetite has not been sated by the volume of new loans in the market. New leveraged buyout (LBO) or M&A deals could boost primary activity; however, LBO deal flow was patchy during 2023 and has only just started picking up this year, while M&A activity remains insipid, with occasional large deals coming to the market in January and February. According to Guggenheim Investments, 70% of all leveraged loans were owned by CLOs as of end-September 2023. The spike in CLO issuance increased the need for new loans, all of which leaves investors with an abundance of dry powder contributing to the market being favourable towards issuers at this point.
For access to our comprehensive news, analysis and data on the global loan and bond markets, please subscribe to Debtwire.
(Past performance is no guarantee of future results.)




Latest news

US leveraged loans returns turn negative in October
The Bloomberg US Leveraged Loan Index (Ticker: LOAN) has returned -0.26% this month through October 21, reducing its year-to-date return…

M&A activity begins to tick upward
In the third quarter of 2026, acquisition-linked loan volume across North America and Europe reached about $47 billion, up from $30.6 billion in Q2 and $29.5 billion a year ago.
