



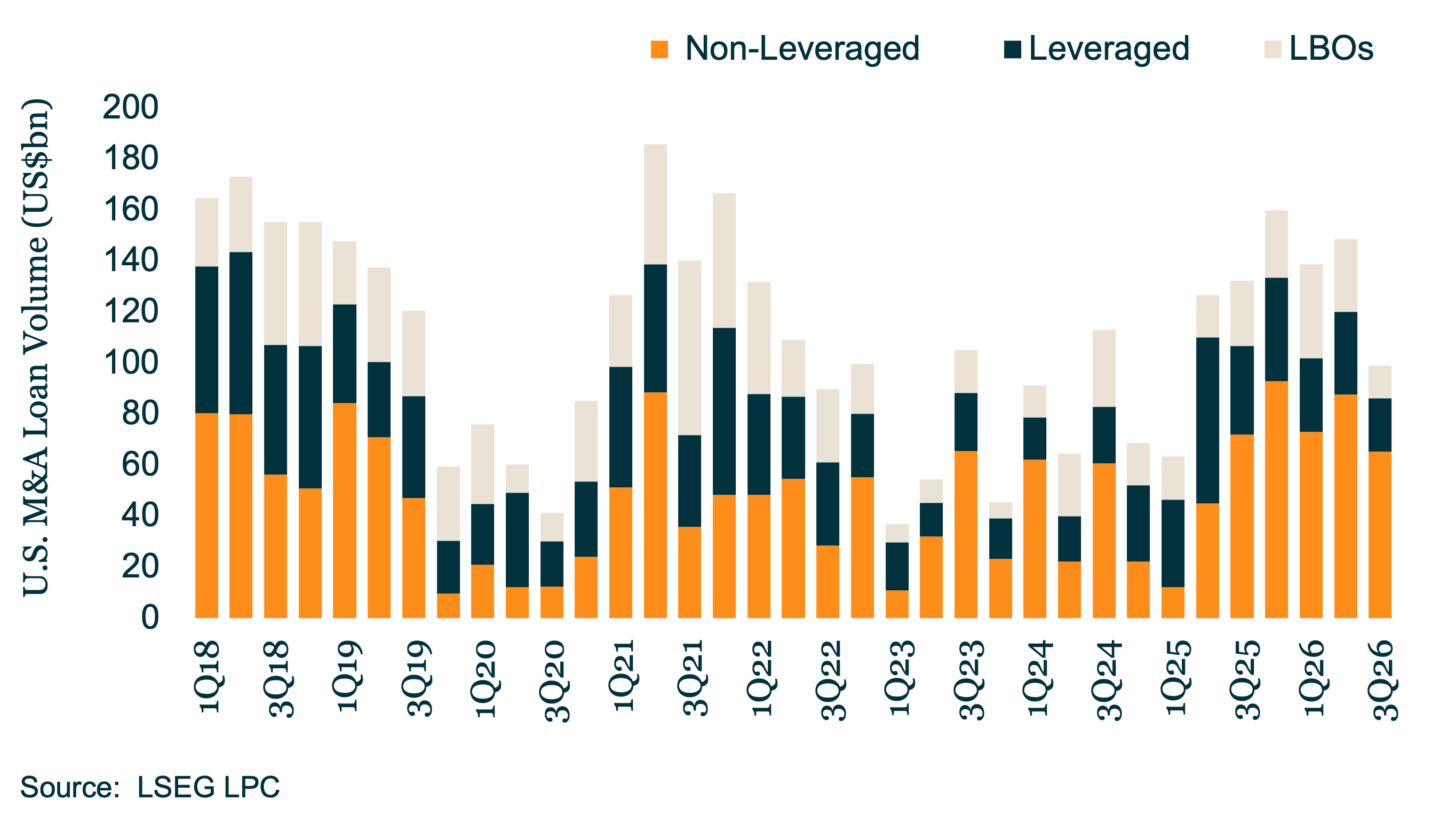
3Q26 M&A loan volume totaled just under US$99bn (down over 25% year-over-year and 33% quarter-over-quarter), pushing issuance for the first nine months of 2026 north of US$386bn, an increase of nearly 20% year-over-year. Lenders noted that the market was broadly constructive and that availability of financing was not an impediment to getting acquisition deals done.
In the investment grade space specifically, 50% of M&A deals came to market with committed financing upon announcement while 50% tapped the market on a best efforts basis or bypassing the loan market to access the bond market directly. High quality borrower Aon went “naked” on its new debt backing its US$17bn purchase of USI Insurance Services from KKR and other shareholders.
Others, including Xylem Inc, issued bridge loans which were promptly taken out, while Ecolab opted for a US$4.75bn delayed draw term loan.
Year-to-date, investment grade issuers have committed to over US$188bn in M&A loan financings, over two times year ago totals. In the leveraged space, the market observed a bit more uneveness. After a relatively slow July marked by a series of repricings, LBO activity picked up in August and September, although at US$161bn, 1-3Q26 leveraged M&A loan volume is down over 17%.



Latest news

Information Technology Topped Nonaccruals on a Cost Basis
The information technology sector moved from second place in the first quarter to the top of the list in the second quarter
Information Technology Topped Nonaccruals on a Cost Basis
The 50 largest BDCs, on the basis of total debt investments as of the second quarter of 2026, accounted for 75% of the total aggregate reported value of nonaccrual debt at cost and fair value.
