



US Leveraged lending tumbled in 3Q15 as market volatility fueled a flight to quality and heightened risk aversion. At less than $180 billion, 3Q15 leveraged lending was down nearly 50% compared to 2Q15 totals to bring 1-3Q15 totals to $753 billion, down 24% compared to the same time last year. Most of the shortfall was rooted in a steep HY bond market slump in 3Q15. In sympathy with the jitters observed in the equity markets in late August, HY bond issuance stalled with just over $37 billion of new issues working their way through the market.
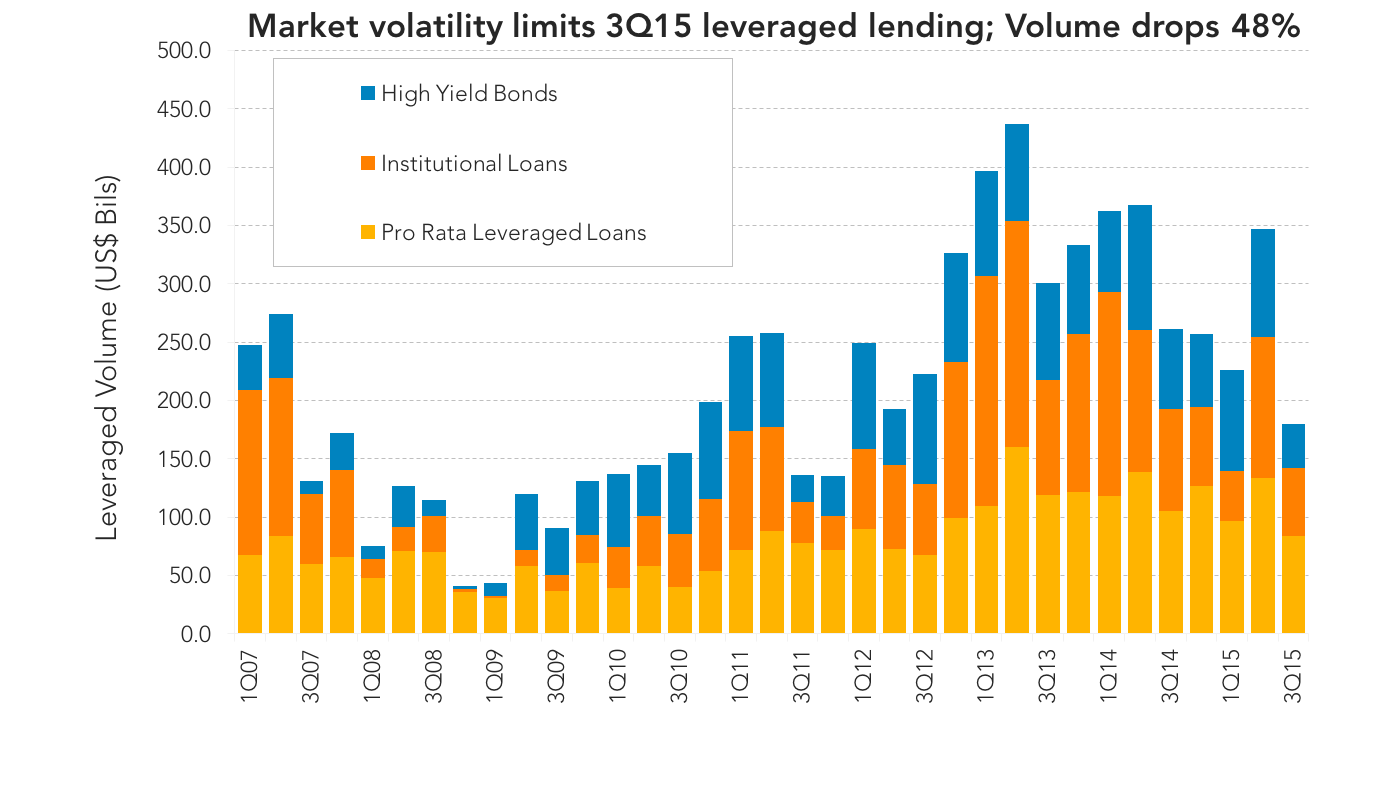 This represented a 60% drop compared to 2Q15 totals. The loan market was a bit more measured in its its response, but opportunistic refinancings evaporated thereby limiting lending activity. Institutional investors became more selective, committing to a relatively thin $58.5 billion in loan assets during the quarter (down from over $121 billion in 2Q15). Pro rata lenders fared a bit better to log nearly $84 billion of issuance, down from $133 billion in 2Q. At just under $537 billion, 1-3Q15 leveraged loan volume was down 28% year over year.
Contact: Maria Dikeos
maria.dikeos@thomsonreuters.com




Latest news

US leveraged loans returns turn negative in October
The Bloomberg US Leveraged Loan Index (Ticker: LOAN) has returned -0.26% this month through October 21, reducing its year-to-date return…

M&A activity begins to tick upward
In the third quarter of 2026, acquisition-linked loan volume across North America and Europe reached about $47 billion, up from $30.6 billion in Q2 and $29.5 billion a year ago.
