



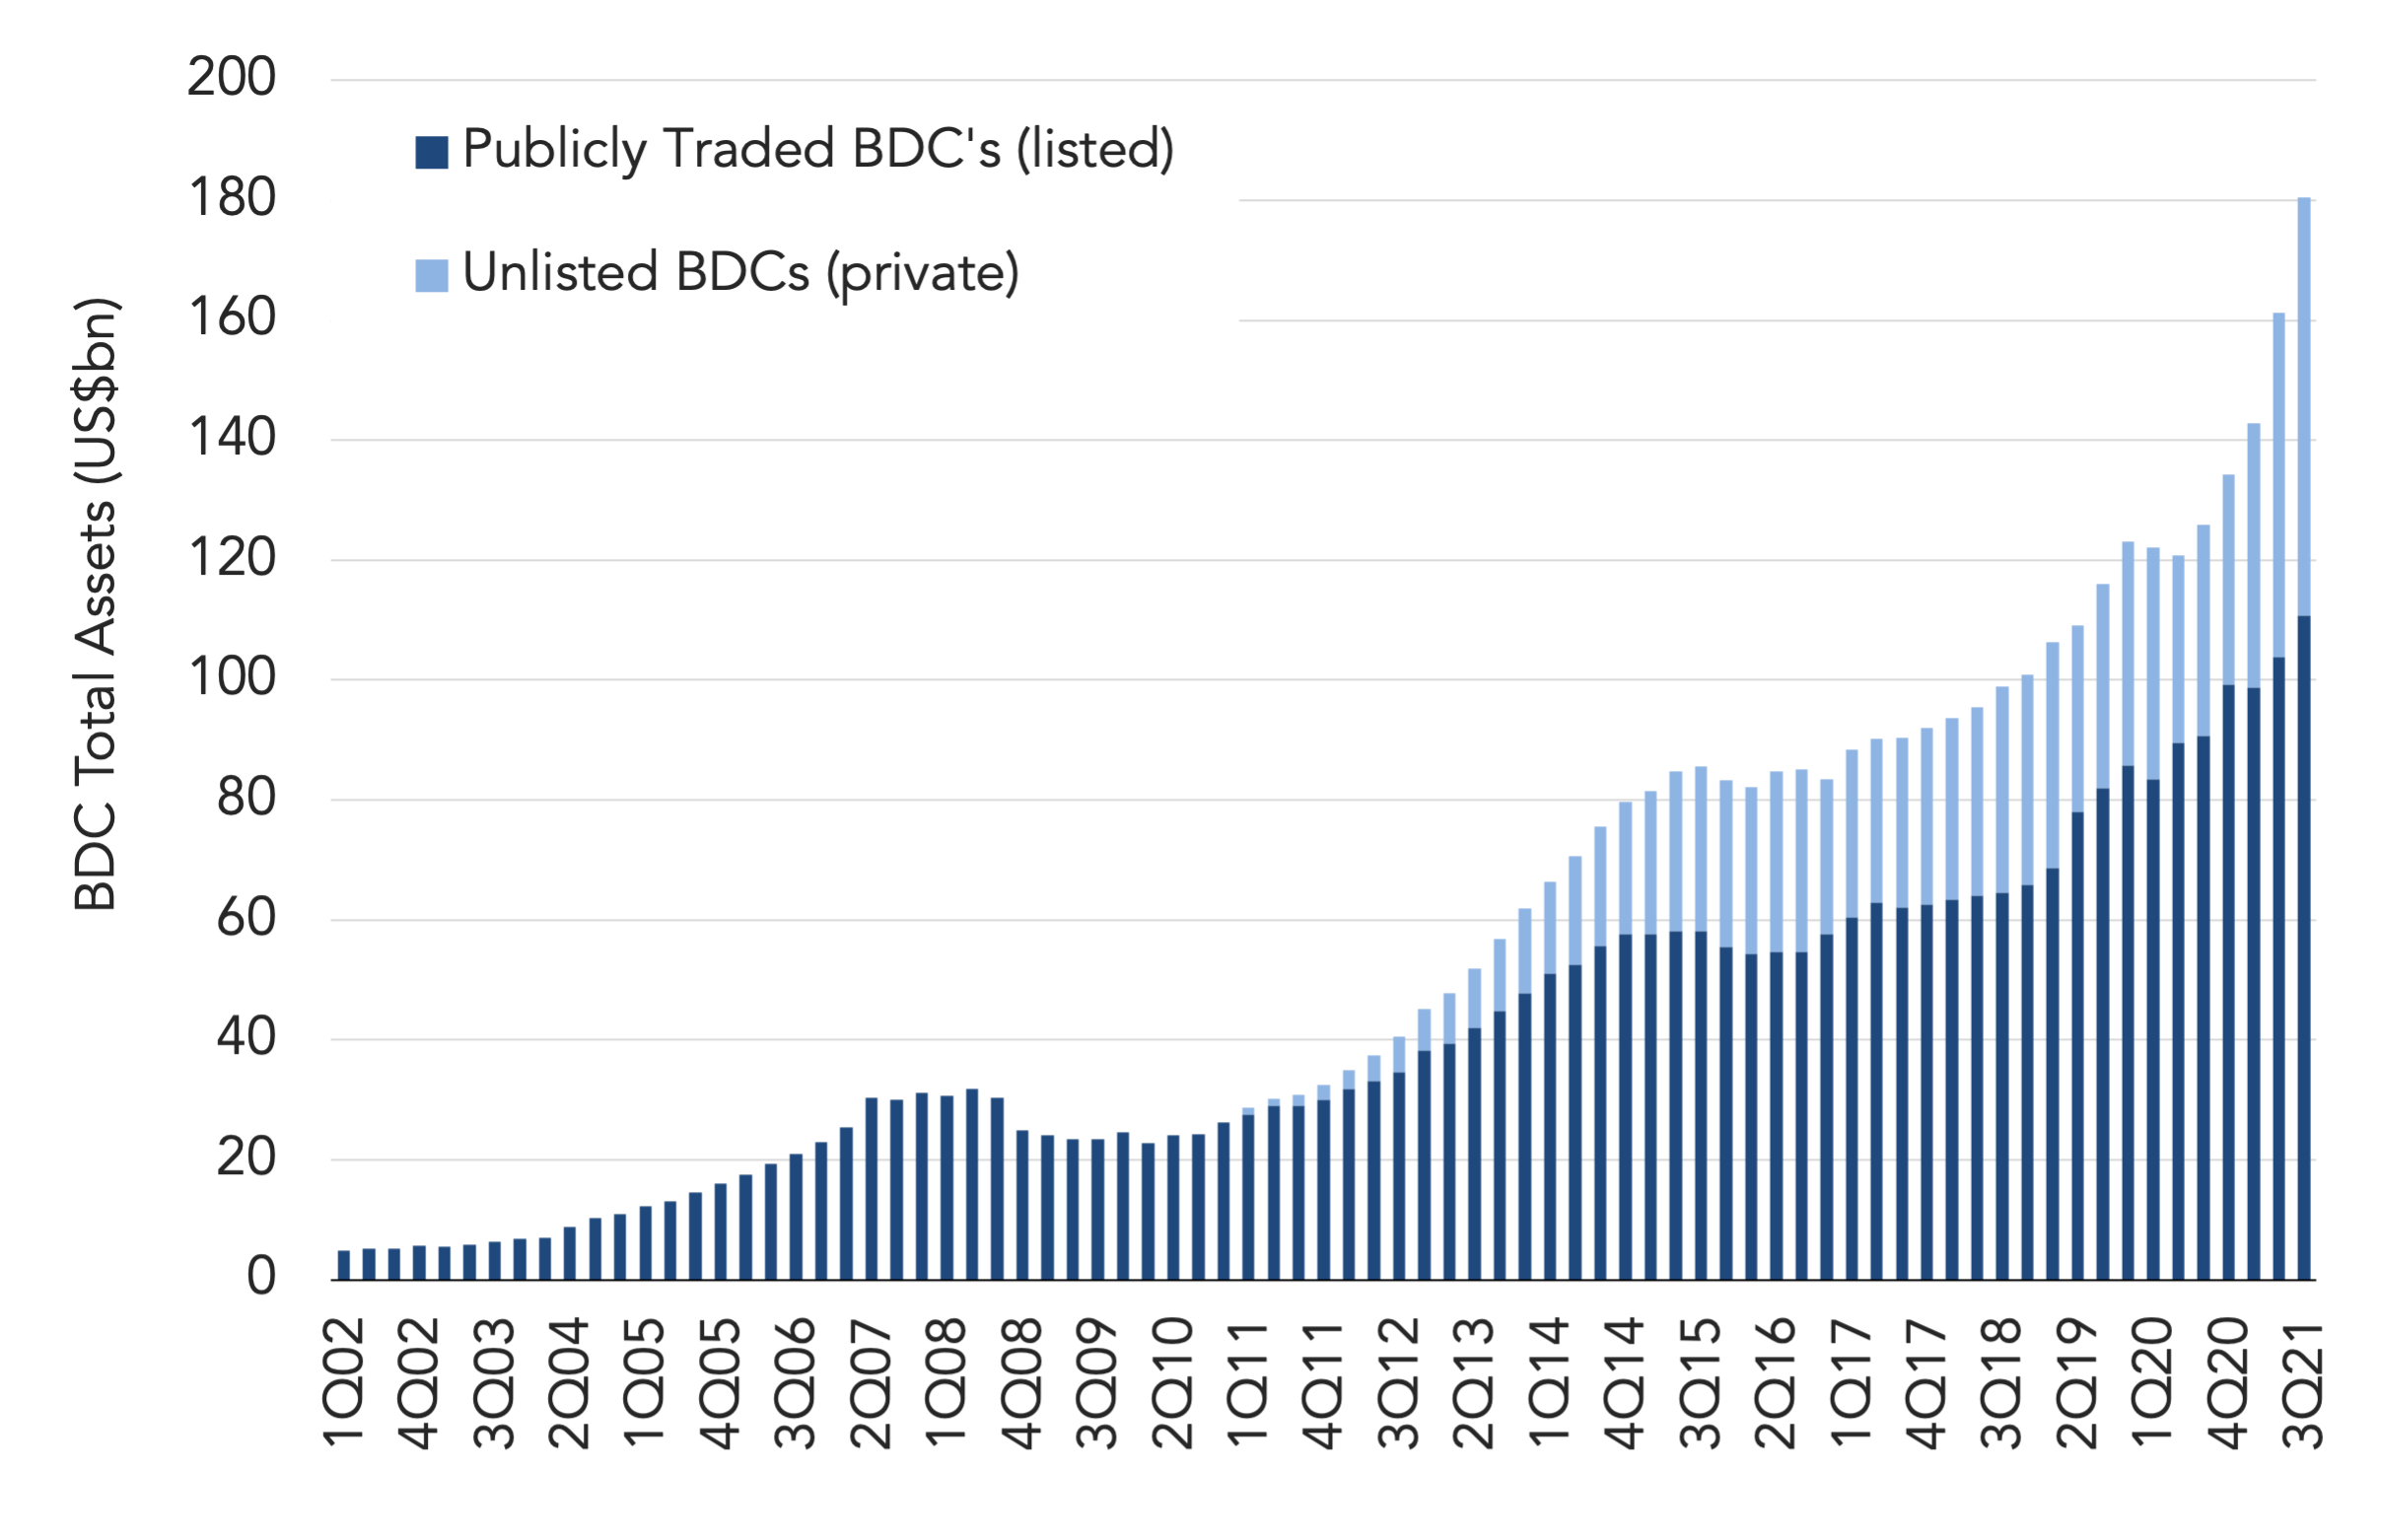
Total assets in BDCs climbed to over US$180bn in 3Q21, as publicly traded BDC assets increased to US$111bn, up from US$104bn in the prior quarter. In the same period, private/unlisted BDC assets grew to US$70bn from US$57bn.
On the private side, Blackstone Private Credit Fund led the way with its portfolio increasing to US$18.9bn in 3Q21 from US$12.1bn, as the fund pulled in money at a rapid clip. Since the end of 3Q21, there has been some shifts between categories, with the Blackstone Secured Lending Fund and its US$8bn-plus portfolio going public on October 28.
There has also been a further concentration of assets among the larger BDCs this year, with the five largest BDC funds seeing their share of total assets increase to 42%, a gain of 5 percentage points since the beginning of the year. The concentration is even more pronounced when looking at the manager level, with the market share of the top 5 managers exceeding 50%.
(Past performance is no guarantee of future results.)




Latest news


PE fund distribution rates
Following 2021, buyout distribution rates have fallen to roughly 10% to 15% below the 25-year average.

Sub line pricing flattens
A report on the topic also finds that investors are less concerned by leverage in NAV loans. Pricing for subscription…