



U.S. CLO portfolio trade prices climb
U.S. CLO portfolio trade prices have climbed from their early 2016 levels. The weighted average purchase was 98.92 in September, with the average sale price at 97.31. For the October trades collected so far, the weighted average purchase price is at 99.24, while selling prices average 97.67. Selling prices were more dispersed than purchase prices in 3Q16, as a higher share of portfolio sales were in the sub-98 and par-plus categories. CLOs sold loans at higher prices in the third quarter, with 50% of sales in the par-plus category, up from 37% in 2Q16.
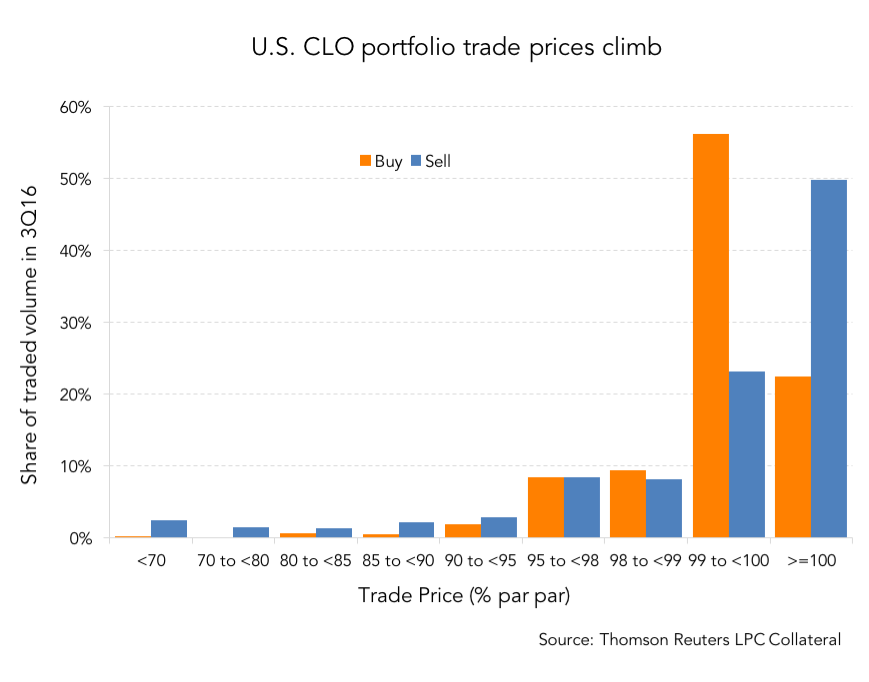
CLOs also bought loans at marginally higher prices, as 22% of purchases were in the par-plus price area in 3Q16 compared to 18% in 2Q16. The most widely purchased names were TXU Corp., Dell Inc. and UPC Broadband Holding. On the sales side, the top names were Valeant Pharmaceuticals, Berry Plastics Corp. and Community Health. Electronics was the most widely traded sector in 3Q16, followed by healthcare and printing/publishing. Looking at trading activity by loan spread and maturity, CLOs purchased a larger share of higher spread loans than they sold and bought more longer dated assets.
Contact: Colm Doherty
colm.doherty@thomsonreuters.com





Latest news

Rate hike expectations ease as term SOFR curve flattens
The CME six-month Term SOFR rate reached a recent high of 3.979% on July 28 before retreating to 3.837% as…
3Q26: New loan assets rise to 44% of total lending, a 3-year high
New loan assets as a proportion of total US loan volume make up 44% of the 3Q26 pipeline to date,…

North American GPs dominant as fundraising accelerates
Our PEI Private Credit 200 ranking also shows capital raising increasing overall – and accelerating especially fast for the largest…