


Evolution of leveraged loans by vintage shows notable reductions in near-term maturity walls

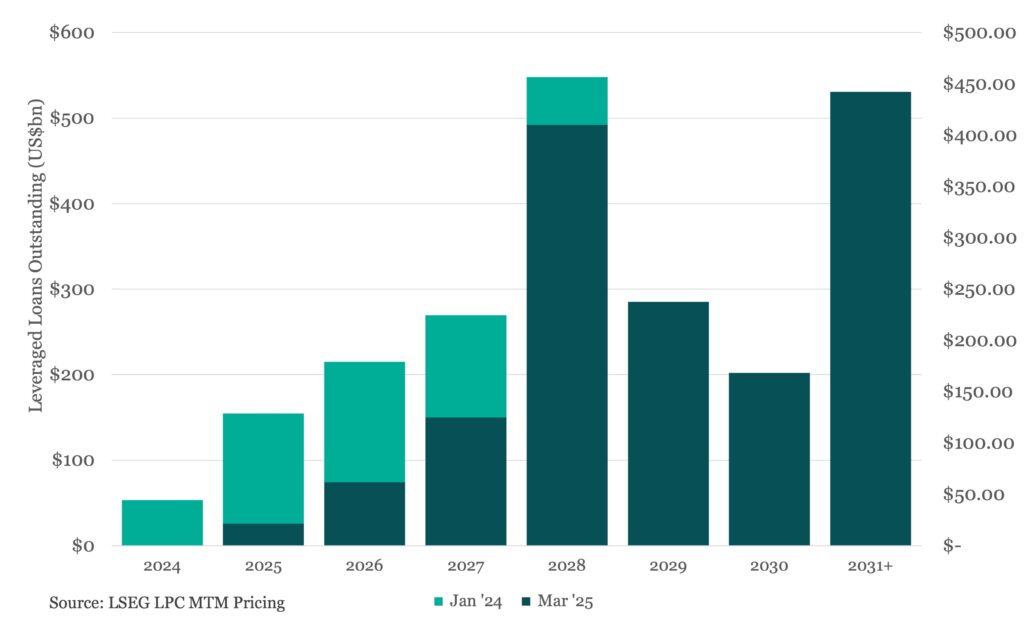
Leveraged loan issuers have continued to proactively manage their capital structures via refinancings and extensions, driving significant reductions in near-term maturity walls over the past 15 months. Since January ’24, more than 50% of leveraged loans maturing through ’28 have been repaid, refinanced, or extended. And during that same timeframe, the percentage of loans maturing in ’28 and beyond has expanded from 35% to approximately 50%. The current maturity wall has eroded almost completely, with only US$21.3bn set to mature by year end, down 86% since the beginning of ’24. Loan outstandings due in ’26 and ’27 also show meaningful progress, having dropped 71% and 54%, respectively. And although issuers have chipped away at their ’28 maturities, which have fallen 25% to US$410bn or nearly 30% of total outstandings, ’28 remains the peak maturity wall for the leveraged loan market. Looking even further out, the ‘31 vintage comes in close second at US$356bn, thanks to record issuance levels from ’24. Worth noting that total outstandings, or the overall size of the leveraged loan market, defined here as actively quoted US secondary loans paying cash interest, has also declined by US$100bn to approximately US$1.4trn.





Latest news

Rate hike expectations ease as term SOFR curve flattens
The CME six-month Term SOFR rate reached a recent high of 3.979% on July 28 before retreating to 3.837% as…

3Q26: New loan assets rise to 44% of total lending, a 3-year high
New loan assets as a proportion of total US loan volume make up 44% of the 3Q26 pipeline to date,…

North American GPs dominant as fundraising accelerates
Our PEI Private Credit 200 ranking also shows capital raising increasing overall – and accelerating especially fast for the largest…