



The BDC industry has shown explosive growth over the last ten years and it has resulted in business development companies becoming a large force in middle market lending. BDCs’ assets under management have reached roughly $80 billion in 2015 and have averaged a 23% CAGR of growth over the last three years according to Wells Fargo Securities. When asked in a live poll at TRLPC’s 3rd Annual Middle Market Loan Conference how large the industry could get over the next five years, respondents were very bullish. 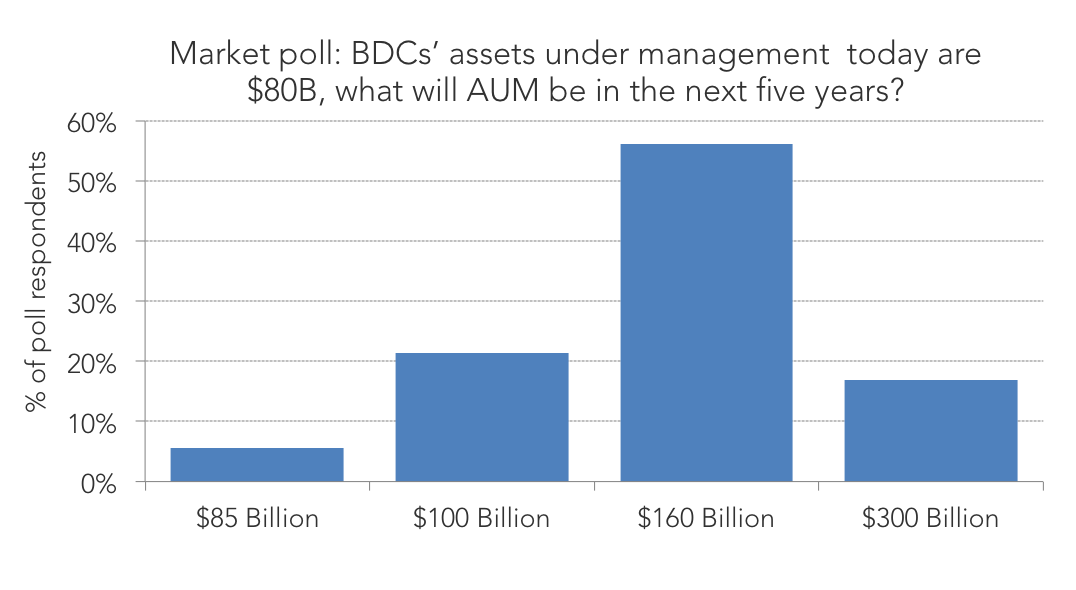 Fifty six percent of respondents believe the industry will double with assets under management reaching $160 billion while another 17% believe we could see AUM go as high as $300 billion. With banks facing regulatory pressures and with GE Capital’s announcement of its exit from lending, it opens up huge opportunities for BDCs to step in and take market share. While the industry has seen many new entrants into the BDC space over the last few years, industry veterans believe the bulk of growth in the space is more likely going to be driven by existing BDC players getting bigger rather than a slew of new entrants over the next few years.
Contact: Fran Beyers
frances.beyers@thomsonreuters.com




Latest news

US leveraged loans returns turn negative in October
The Bloomberg US Leveraged Loan Index (Ticker: LOAN) has returned -0.26% this month through October 21, reducing its year-to-date return…

M&A activity begins to tick upward
In the third quarter of 2026, acquisition-linked loan volume across North America and Europe reached about $47 billion, up from $30.6 billion in Q2 and $29.5 billion a year ago.
