



After declining dramatically for two consecutive quarters due to fears of being penalized by the regulators, LBO leverage is back on the rise this quarter. Debt to EBITDA on large corporate and institutional middle market buyout deals has risen to 6.27 times and 5.50 times respectively so far in 2Q15, up from 5.99 and 5.32 times last quarter. It seems sponsors and lenders have pushed leverage to the mid-to-high six times area on quite a few deals this quarter including Prime Source Building Products, Air Medical, WASH Multi Family Laundry, and Sterigenics. 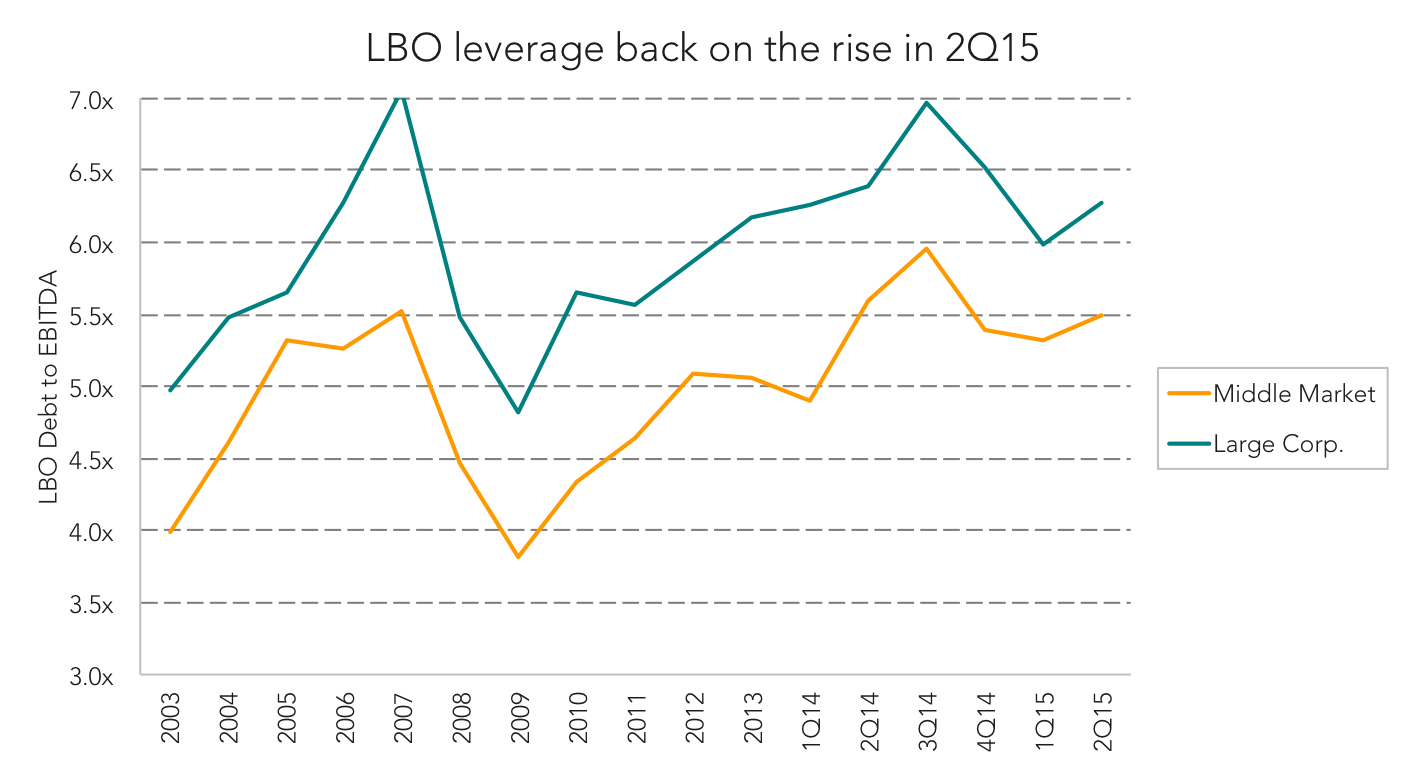 And even one deal was able to obtain leverage over seven times. The largest LBO deal this quarter, Informatica Corp, is exhibiting “adjusted” leverage of over 9 times according to Moody’s Investors Service. However, the issuer’s high recurring revenue stream and impressive gross margins supports a strong de-leveraging profile. Institutional middle market LBO deals, though few and far between this year, have also showed lofty leverage levels. The vast majority all have leverage over five times bringing the average back to buyout boom levels. Supply of middle market paper has been strapped, so buyout deals to hit market have experienced pretty favorable executions and strong demand.
Contact: Fran Beyers
frances.beyers@thomsonreuters.com




Latest news

US leveraged loans returns turn negative in October
The Bloomberg US Leveraged Loan Index (Ticker: LOAN) has returned -0.26% this month through October 21, reducing its year-to-date return…

M&A activity begins to tick upward
In the third quarter of 2026, acquisition-linked loan volume across North America and Europe reached about $47 billion, up from $30.6 billion in Q2 and $29.5 billion a year ago.
