


As overall issuance slips in 2Q25, strategic M&A remains a bright spot for LevFin market

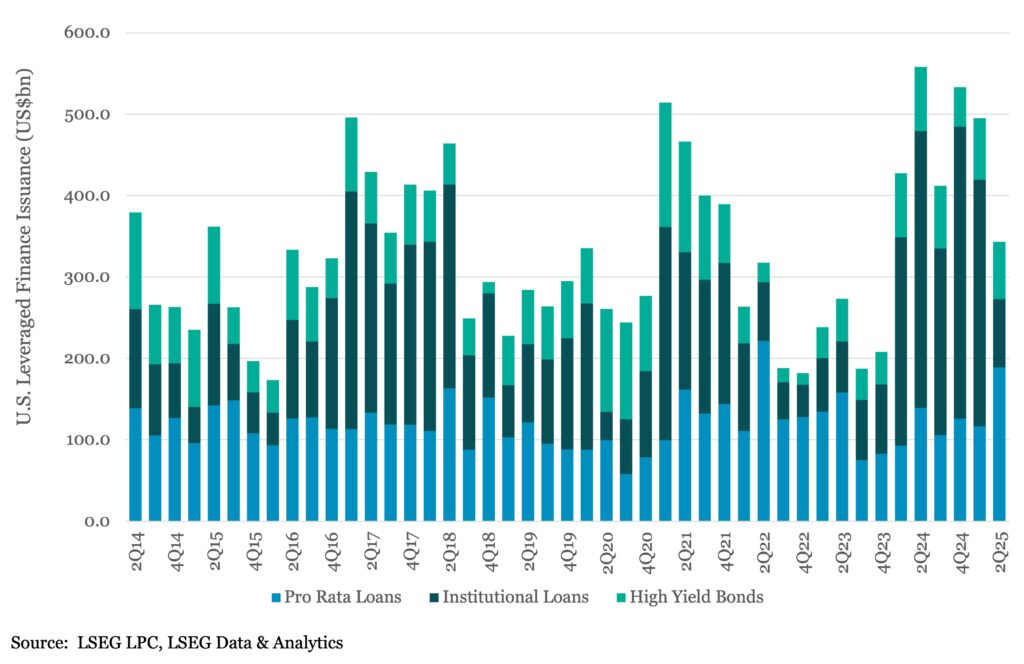
Leveraged finance issuance topped US$343bn in 2Q25, down approximately 30% from 1Q25 and off nearly 40% versus 2Q24. Year-to-date numbers reflect a similar (albeit less pronounced) downside move, with total issuance reaching US$838bn in 1H25, down 15% from 1H24. And no matter how you comp the issuance numbers (2Q25 versus 1Q25, 2Q25 versus 2Q24, or 1H25 versus 1H24), they all tell the same exact story: bank loans have gained the most traction while institutional loans have declined significantly, with high-yield bonds trending marginally lower. And the prime takeaway from this story is that refinancings (down 53% on the quarter with repricings off more than 90%) have not only hampered overall issuance numbers, but also masked the largest underlying strength of the market: new dealmaking. Leveraged new money issuance exceeded US$122bn in 2Q25, up 21% from 1Q25 and more than 30% above 2Q24. That figure comes to US$224bn through the first half of ’25, a 40% uptick from the same period last year. What’s been the catalyst there? Strategic M&A underwrites have not only expanded, but also subsidized decelerated trades in sponsor/LBO finance. While LBO issuance has fallen 38% to US$23bn through first half of ’25, overall M&A issuance is up nearly 65% at US$117bn.





Latest news

Rate hike expectations ease as term SOFR curve flattens
The CME six-month Term SOFR rate reached a recent high of 3.979% on July 28 before retreating to 3.837% as…
3Q26: New loan assets rise to 44% of total lending, a 3-year high
New loan assets as a proportion of total US loan volume make up 44% of the 3Q26 pipeline to date,…

North American GPs dominant as fundraising accelerates
Our PEI Private Credit 200 ranking also shows capital raising increasing overall – and accelerating especially fast for the largest…