



Over $429 billion of syndicated loan volume worked its way through the market in 3Q14, to push 1-3Q14 totals north of $1.5 trillion. Although year to date issuance was down a relatively modest 5 percent year over year, 3Q14 lending alone was down 28 percent compared to 2Q14 and off 17 percent compared to 3Q13 totals. Most of the shortfall can be traced to the smaller number of opportunistic refinancings which came to market. 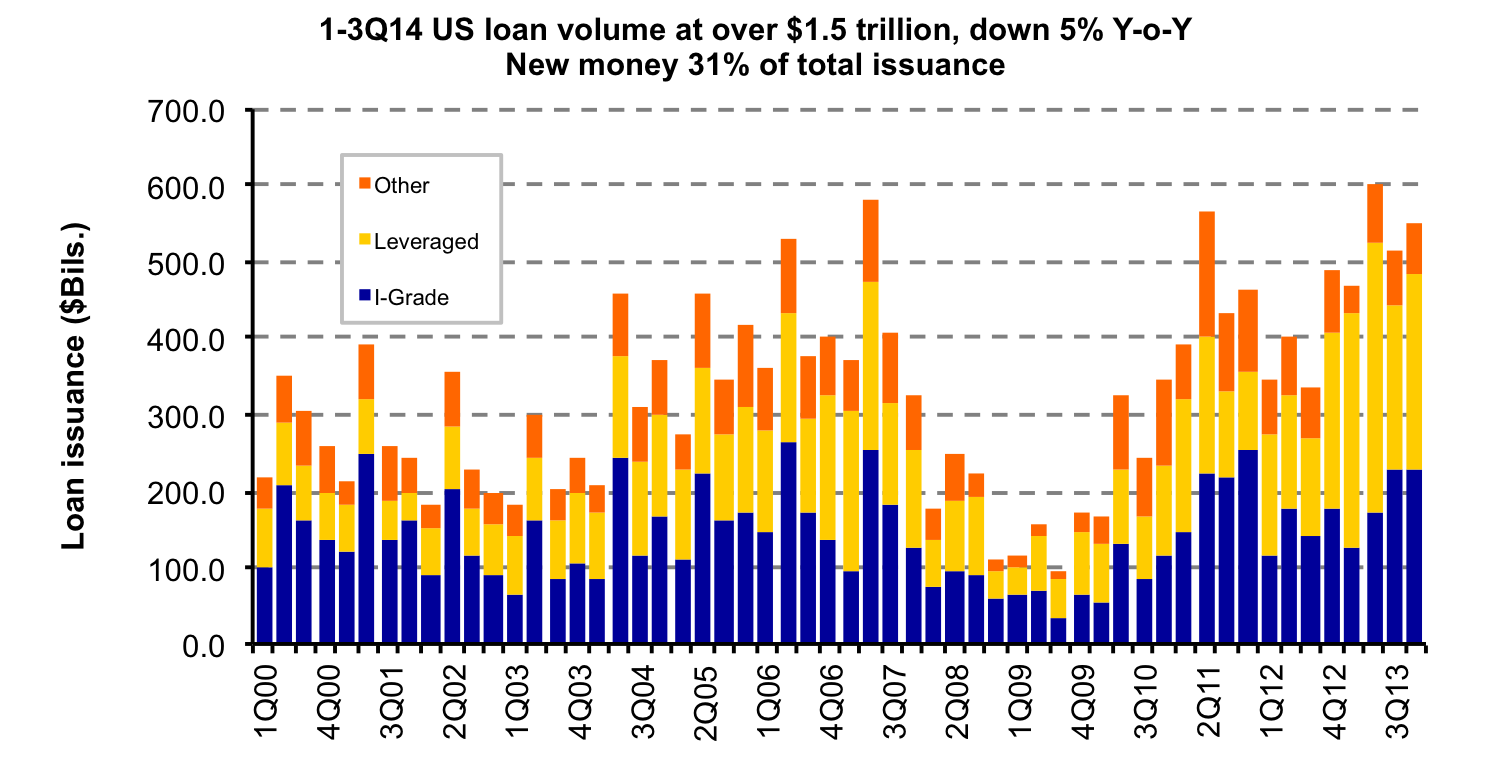 This was largely in the context of leveraged deal flow which saw several refinancings postponed in August amid retail outflows and broader market unrest in the equity and HY bond markets. Nevertheless, there was plenty of liquidity to be had, and investors were eager to put money to work. At nearly $567 billion, 1-3Q14 investment grade volume was up over 8.5 percent compared to year ago levels (although issuance was down quarter over quarter and year over year in 3Q). Leveraged issuance totaled $728 billion for the first nine months of the year, down 17 percent compared to the same time last year. At nearly $460 billion, new money transactions made up almost 31 percent of 1-3Q14 issuance. Over $301 billion of new money – or roughly 66 percent – came in the form of M&A transactions. In the leveraged arena, 3Q14 M&A volume ($55 billion) was down compared to 2Q14 totals, but 1-3Q14 totals were up 26 percent over year ago levels at over $187 billion. 3Q14 LBO volume slowed to just under $17 billion (down from $28 billion in 2Q14) while year to date volume remained flat at $66 billion. Investment grade lenders saw a more substantial 20 percent increase in 3Q14 M&A volume (compared to 2Q14), bringing 1-3Q totals to nearly $103 billion. Underliers



Latest news

PIK Your Next Adventure
Every amended PIK loan hits the same crossroad. Not everyone ends up at the same destination.
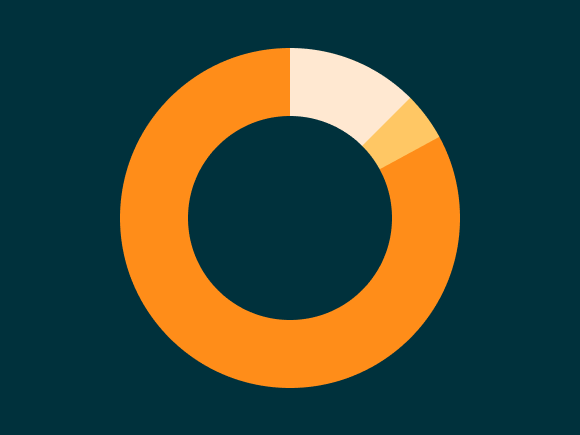
Top 50 BDCs Accounted for 75% of Nonaccrual Loan Cost in Q2’26
The 50 largest BDCs, on the basis of total debt investments as of the second quarter of 2026, accounted for 75% of the total aggregate reported value of nonaccrual debt at cost and fair value.
Private Credit Defaults 101: Beyond the Noise
Like any good school year, this series went by fast. But unlike the end of the year, we’re not out for the summer.