


Markit Recap – 7/3/2017

Senior Financials trading tighter than Corporates
The fate of corporates and the banks that serve them is intertwined; that much is clear from the past decade. But though the correlation is close, it’s certainly not one-to-one.
Governments have a major role to play in post-crisis economies, and the various layers of intervention can dislocate banks from trends in corporate profitability. The stage of the credit cycle can also affect relative performance.
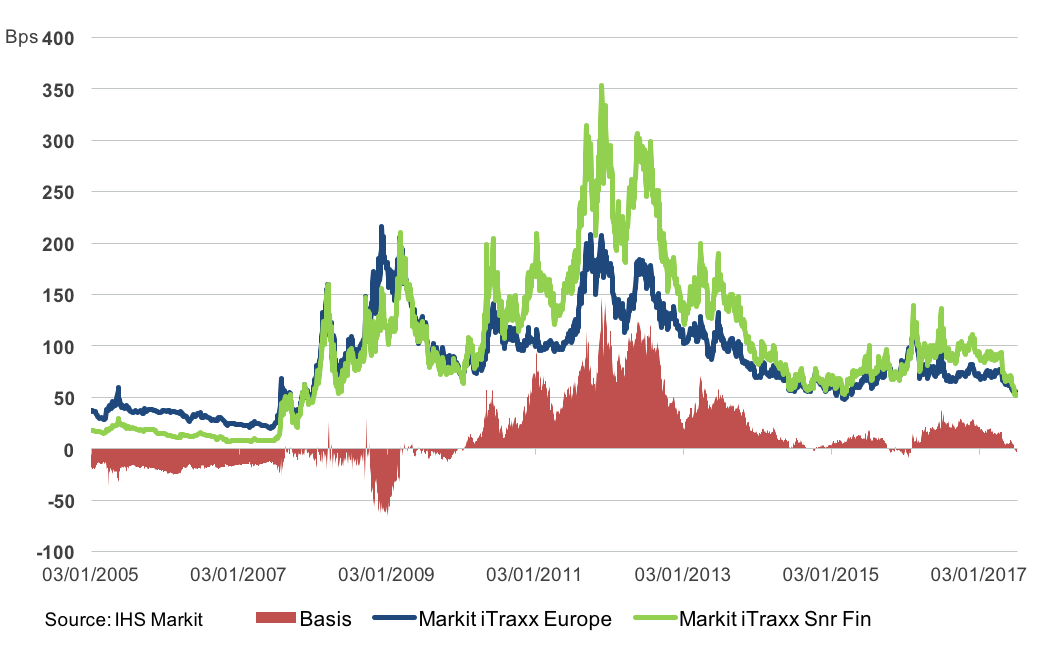
If we look the relationship from a credit perspective, we can see that financials and the broader corporate sector move in the same direction. The chart shows the Markit iTraxx Europe and iTraxx Senior Financials over the past twelve years, and the correlation is clear.
But it is also apparent that the two indices don’t move in parallel. The constituents of the financials index are a subset of the main index, but both indices are tradable and have their own supply and demand dynamics. In the latter years of the credit boom, when the iTraxx Senior Financials was trading at a might 7bps, it was the norm that it would trade tight to the main. Even the Great Financial Crisis did little to shift this relationship; indeed, it exacerbated it as central banks stepped in with extraordinary support for banks.
The crisis that followed, however, did provide the catalyst. Greece’s debt problems and the subsequent contagion across the eurozone’s periphery caused bank spreads to balloon wider as the inherent flaws in the structure of the currency bloc were laid bare. In the last quarter of 2011, when the markets were concerned that Spain and Italy were in danger, the iTraxx Senior Financials traded at levels in excess of 350bps, a full 148bps wider than the Main. Since the onset of the Eurozone debt crisis, the Senior Financials index trading wider than the Main has become the norm.
But the basis has shrunk in recent years and reversed in late 2015, when the oil price was declining sharply and corporates underperformed. It went back into positive territory soon after, but in the last two weeks it has been driven back into negative numbers – the financials index is trading tighter than the Main for the first time since February 2016. In this case the reversal is driven by banks – in particular senior debt – outperforming.
The tier of debt is crucial in the context of what has happened in Italy over the past few weeks. It was all too obvious that the Italian authorities were extremely reluctant to bail-in senior debt holders for the two regional banks that were rescued last month. If they had suffered losses – which they would have done under resolution due to their thin buffer of subordinated debt – then it could have sent waves across Europe and prevented the recent spread compression.
If we leave the dubious political rationale for the bailout structure to one side, the cleanup of the Italian banking industry – EU approval for the Monte dei Paschi rescue was granted this week – should remove yet another potential trigger of volatility. It may take a concerted move from one of the major central banks and a decisive shift in monetary policy to alter credit sentiment.
Contact: Gavan Nolan
Gavan.Nolan@ihsmarkit.com



Latest news

Open Tab
Leveraged loans keep running up a tab. Senior direct lending already knows what it owes.


Information technology topped nonaccruals on a cost basis
Maturities of loans switching to at least partial PIK tends to be longer-dated than Octus’ other stress trackers: nonaccrual and fair value write-down reports.