



Click here to learn more.
Fitch’s Privately Monitored Ratings Portfolio Overview, 3Q25
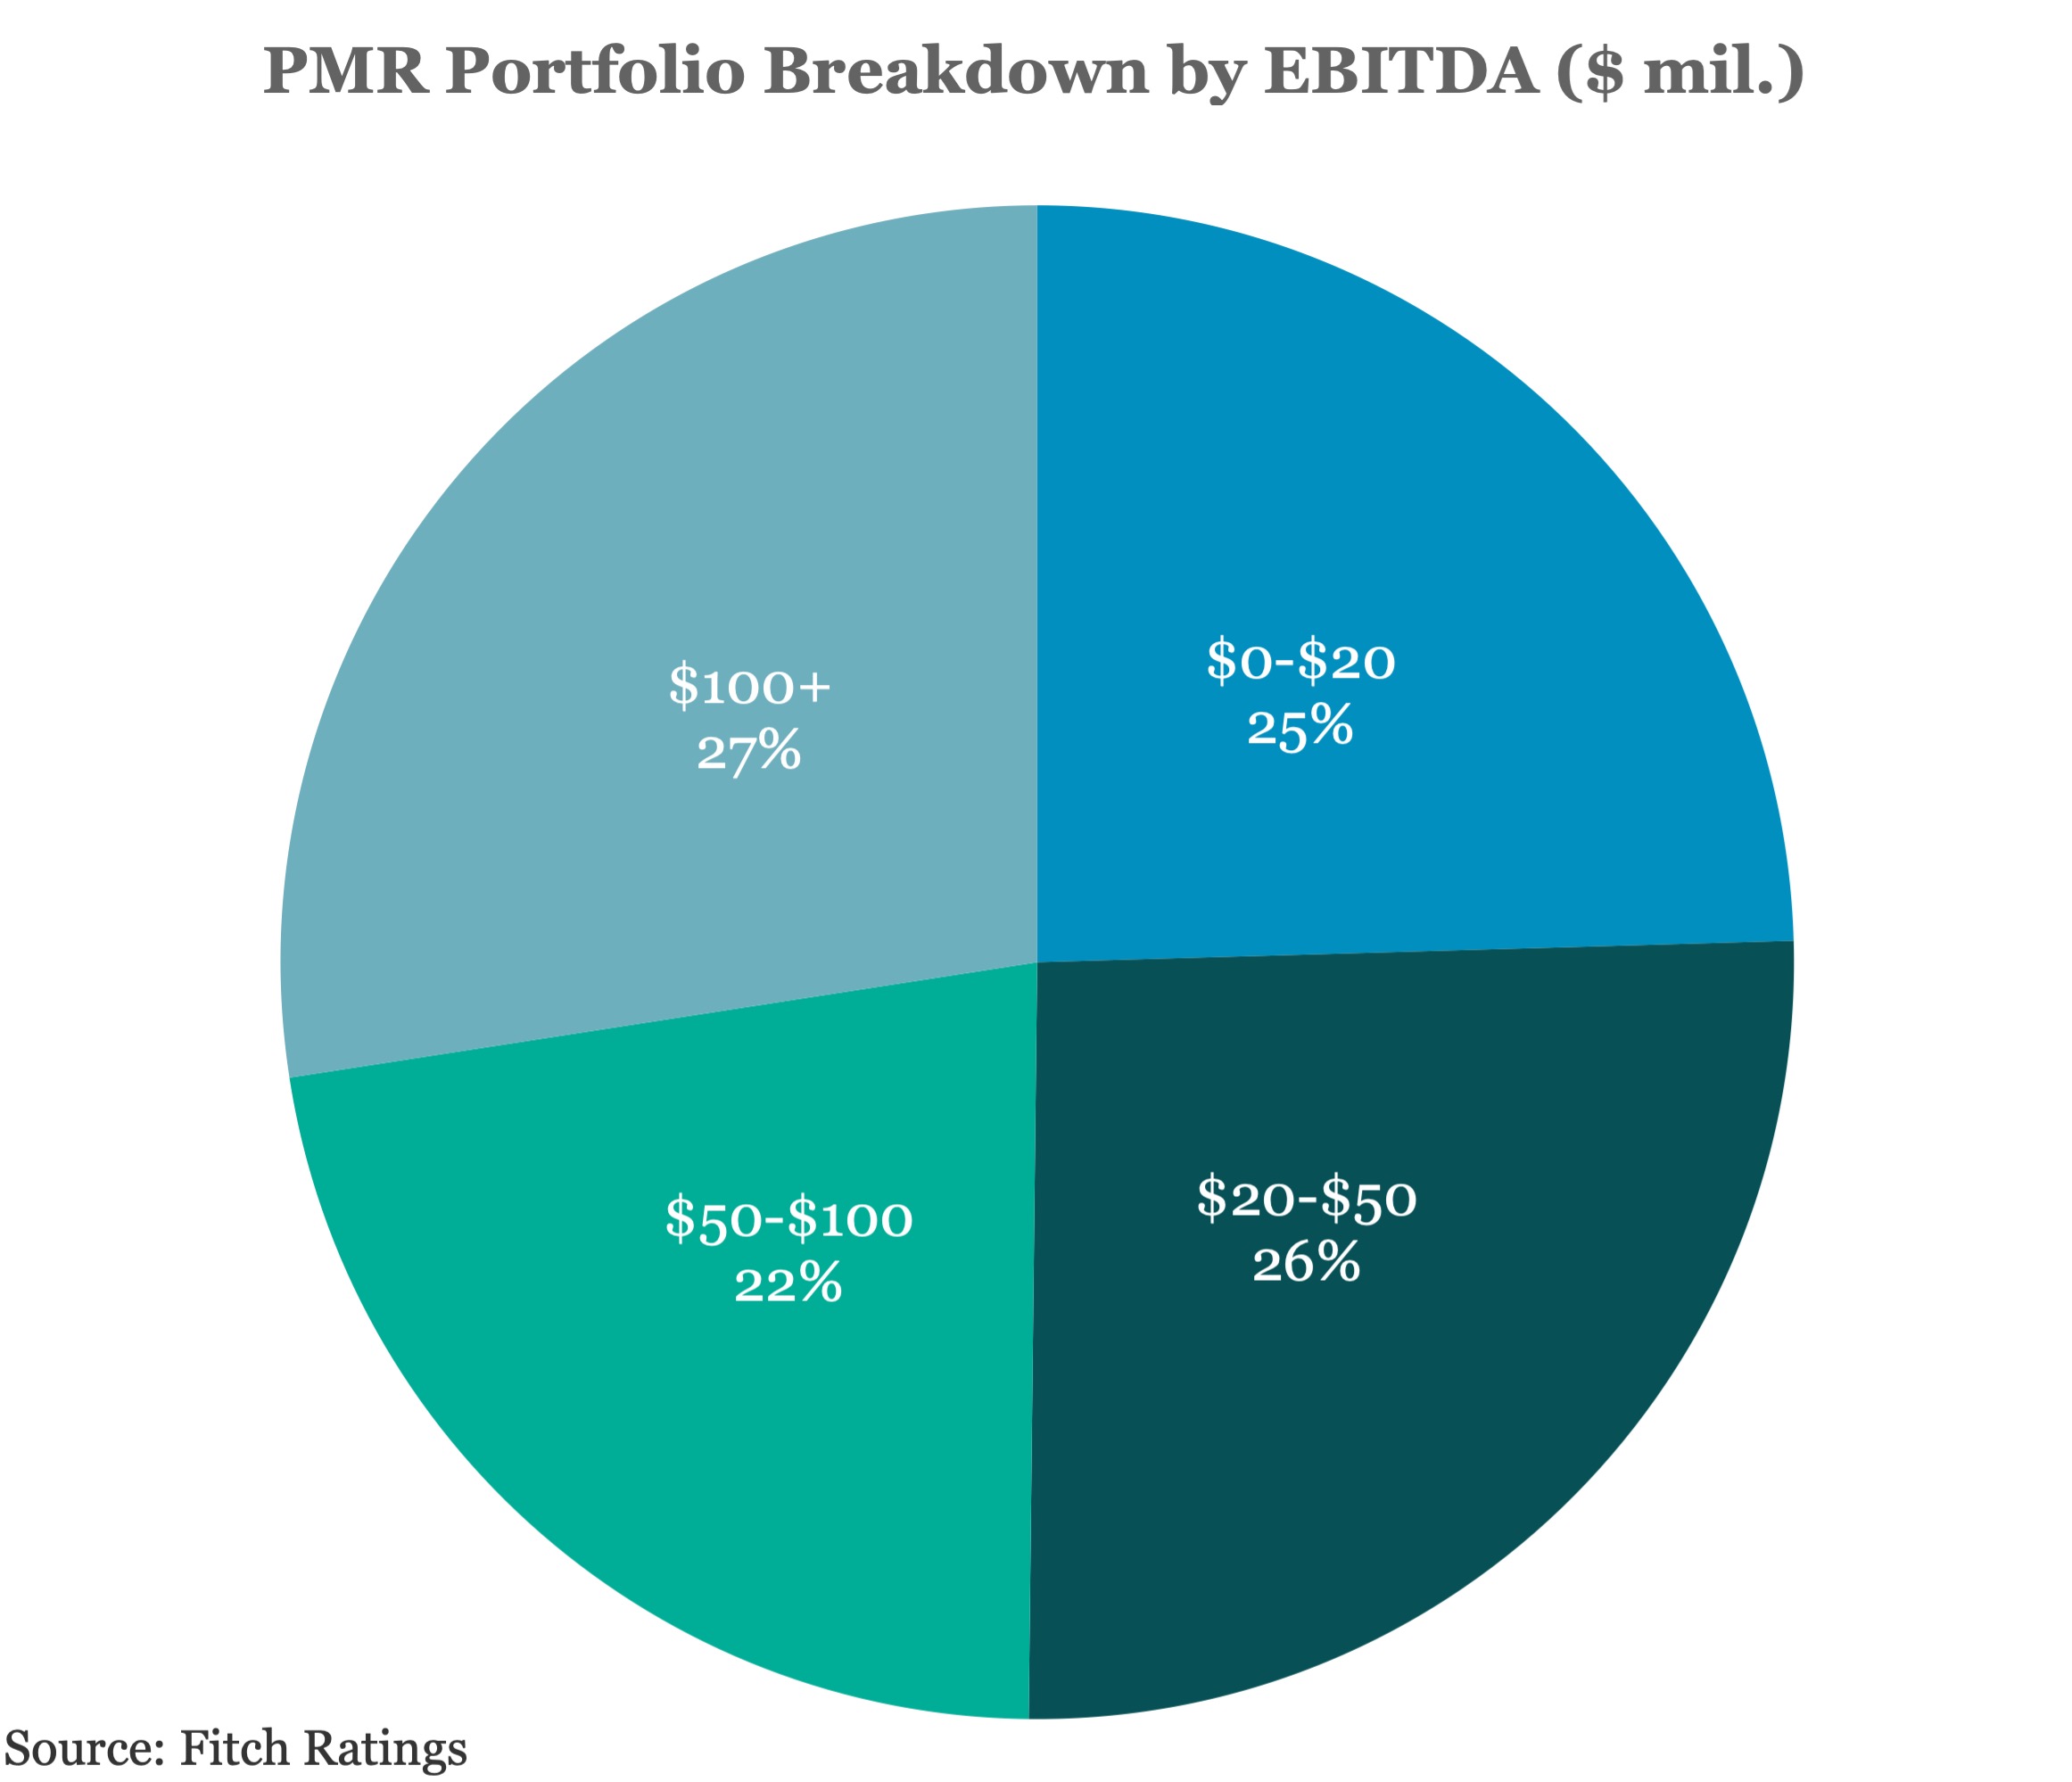
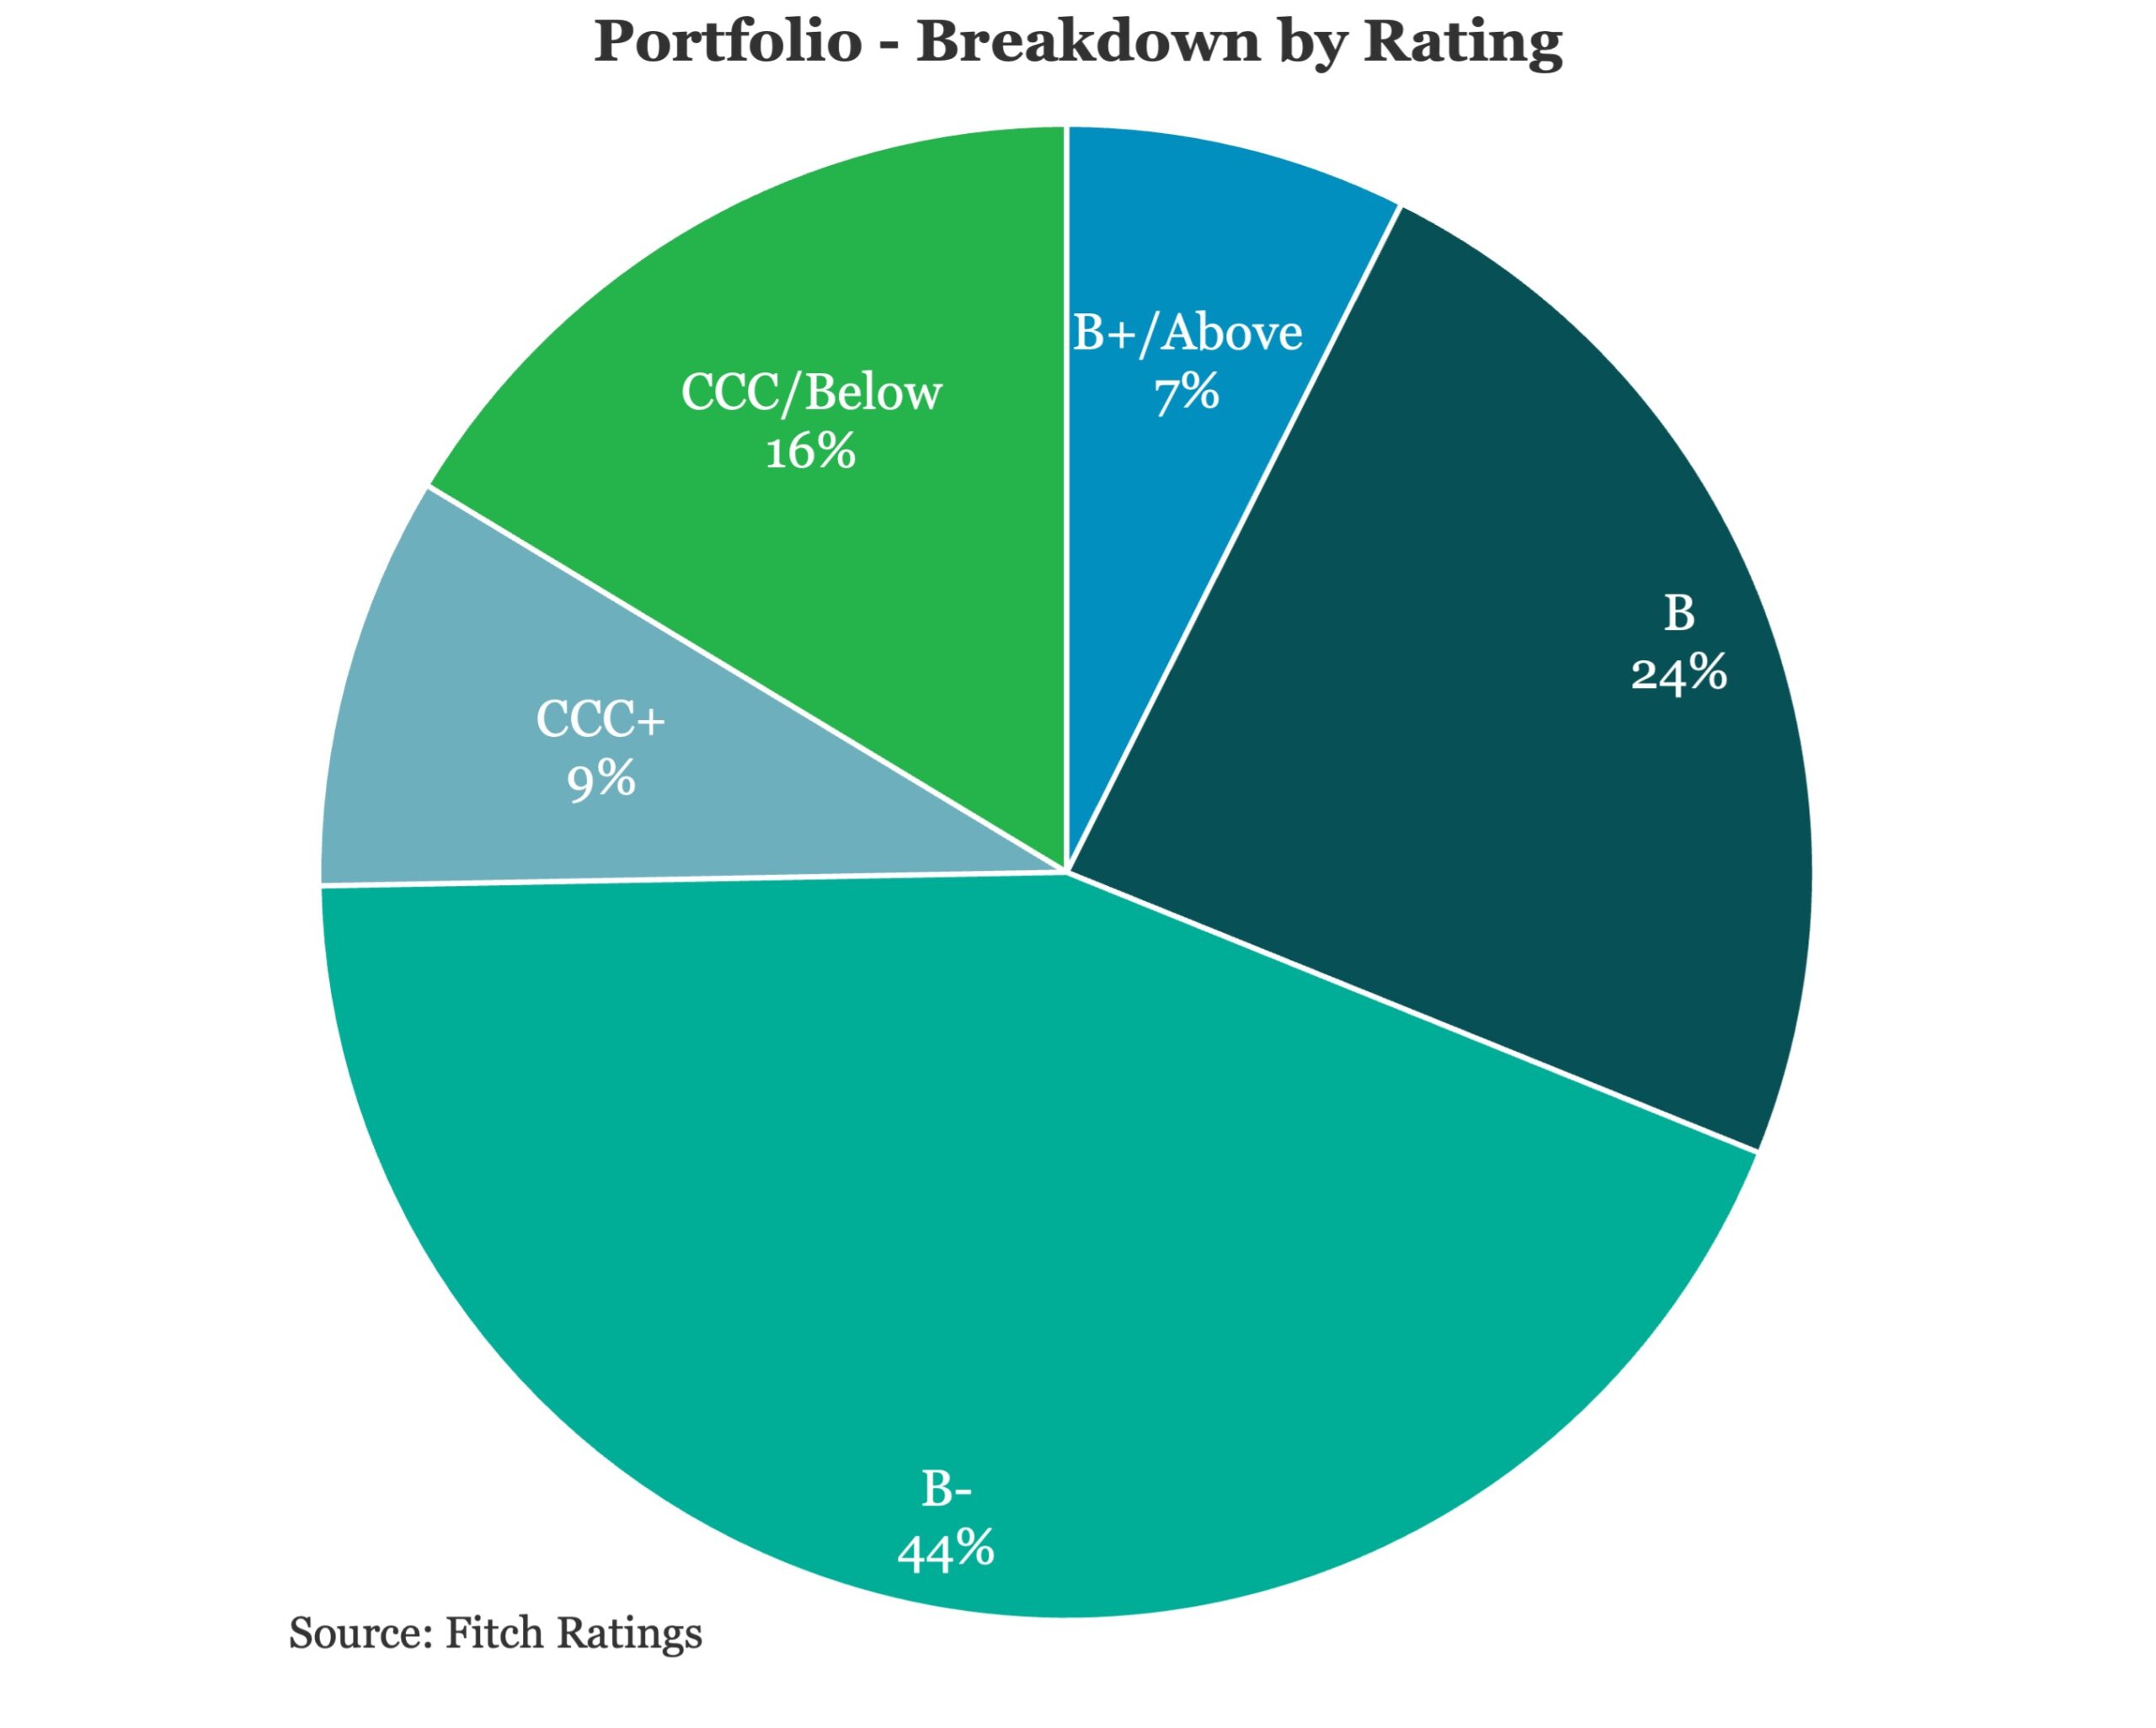
In the charts above, Fitch presents aggregate data for issuers in its PMR portfolio. Fitch privately rates these issuers on behalf of asset managers.
- Fitch projects revenue growth to slow from 6.3% in 2024 to 6.0% in 2025F, trending in line with Fitch’s US GDP forecast slowdown to 1.6% in 2025F from 2.8% in 2024.
- Fitch calculates median EBITDA leverage for the PMR portfolio at 6.1x in 2024, and forecasts improvement to 5.9x in 2025F. Most sectors show stable leverage with a slight delevering bias.
- Diversified manufacturing’s median leverage is forecast to improve from 8.1x in 2024 to 6.0x in 2025F, supported by revenue growth and improving EBITDA margins. In contrast, the consumer products sector is forecast to increase to 7.2x in 2025F, up from 6.1x in 2024, reflecting weaker US consumption growth (down from 2.8% in 2024 to 1.6% annualized in 1H25) that will affect revenue.
- Fitch calculates median interest coverage for the PMR portfolio at 1.7x in 2024 and forecasts 1.9x for 2025F. Coverage relief follows Federal Reserve rate cuts of 25 bps in September and October. Fitch expects three more cuts in 2026 given mild tariff impacts on core inflation and a softening labor market.
Contact Contacts: Brad Hamner



Latest news


Information technology topped nonaccruals on a cost basis
October 14, 2026
Maturities of loans switching to at least partial PIK tends to be longer-dated than Octus’ other stress trackers: nonaccrual and fair value write-down reports.

US Broadly Syndicated Loan CLO Defaults in 3Q26 Driven by Distressed Debt Exchanges
October 14, 2026
Out of court restructurings drove nearly all default activity within Fitch-rated U.S. broadly syndicated loan (BSL) CLO portfolios in 3Q26, Fitch Ratings says.