



Fundraising may be a struggle for some, but for those with senior debt strategies the outlook is somewhat brighter.
In last week’s edition of PDI Picks, we brought you our global private debt fundraising figures for the first quarter of this year. If you recall, they showed a still subdued environment for those collecting investor capital, with less than $40 billion raised by only 34 funds during the three-month period. There was no real indication of any significant change from last year when investors had to deal with the consequences of a pandemic and were wary of making new commitments outside of trusted brand-name managers.
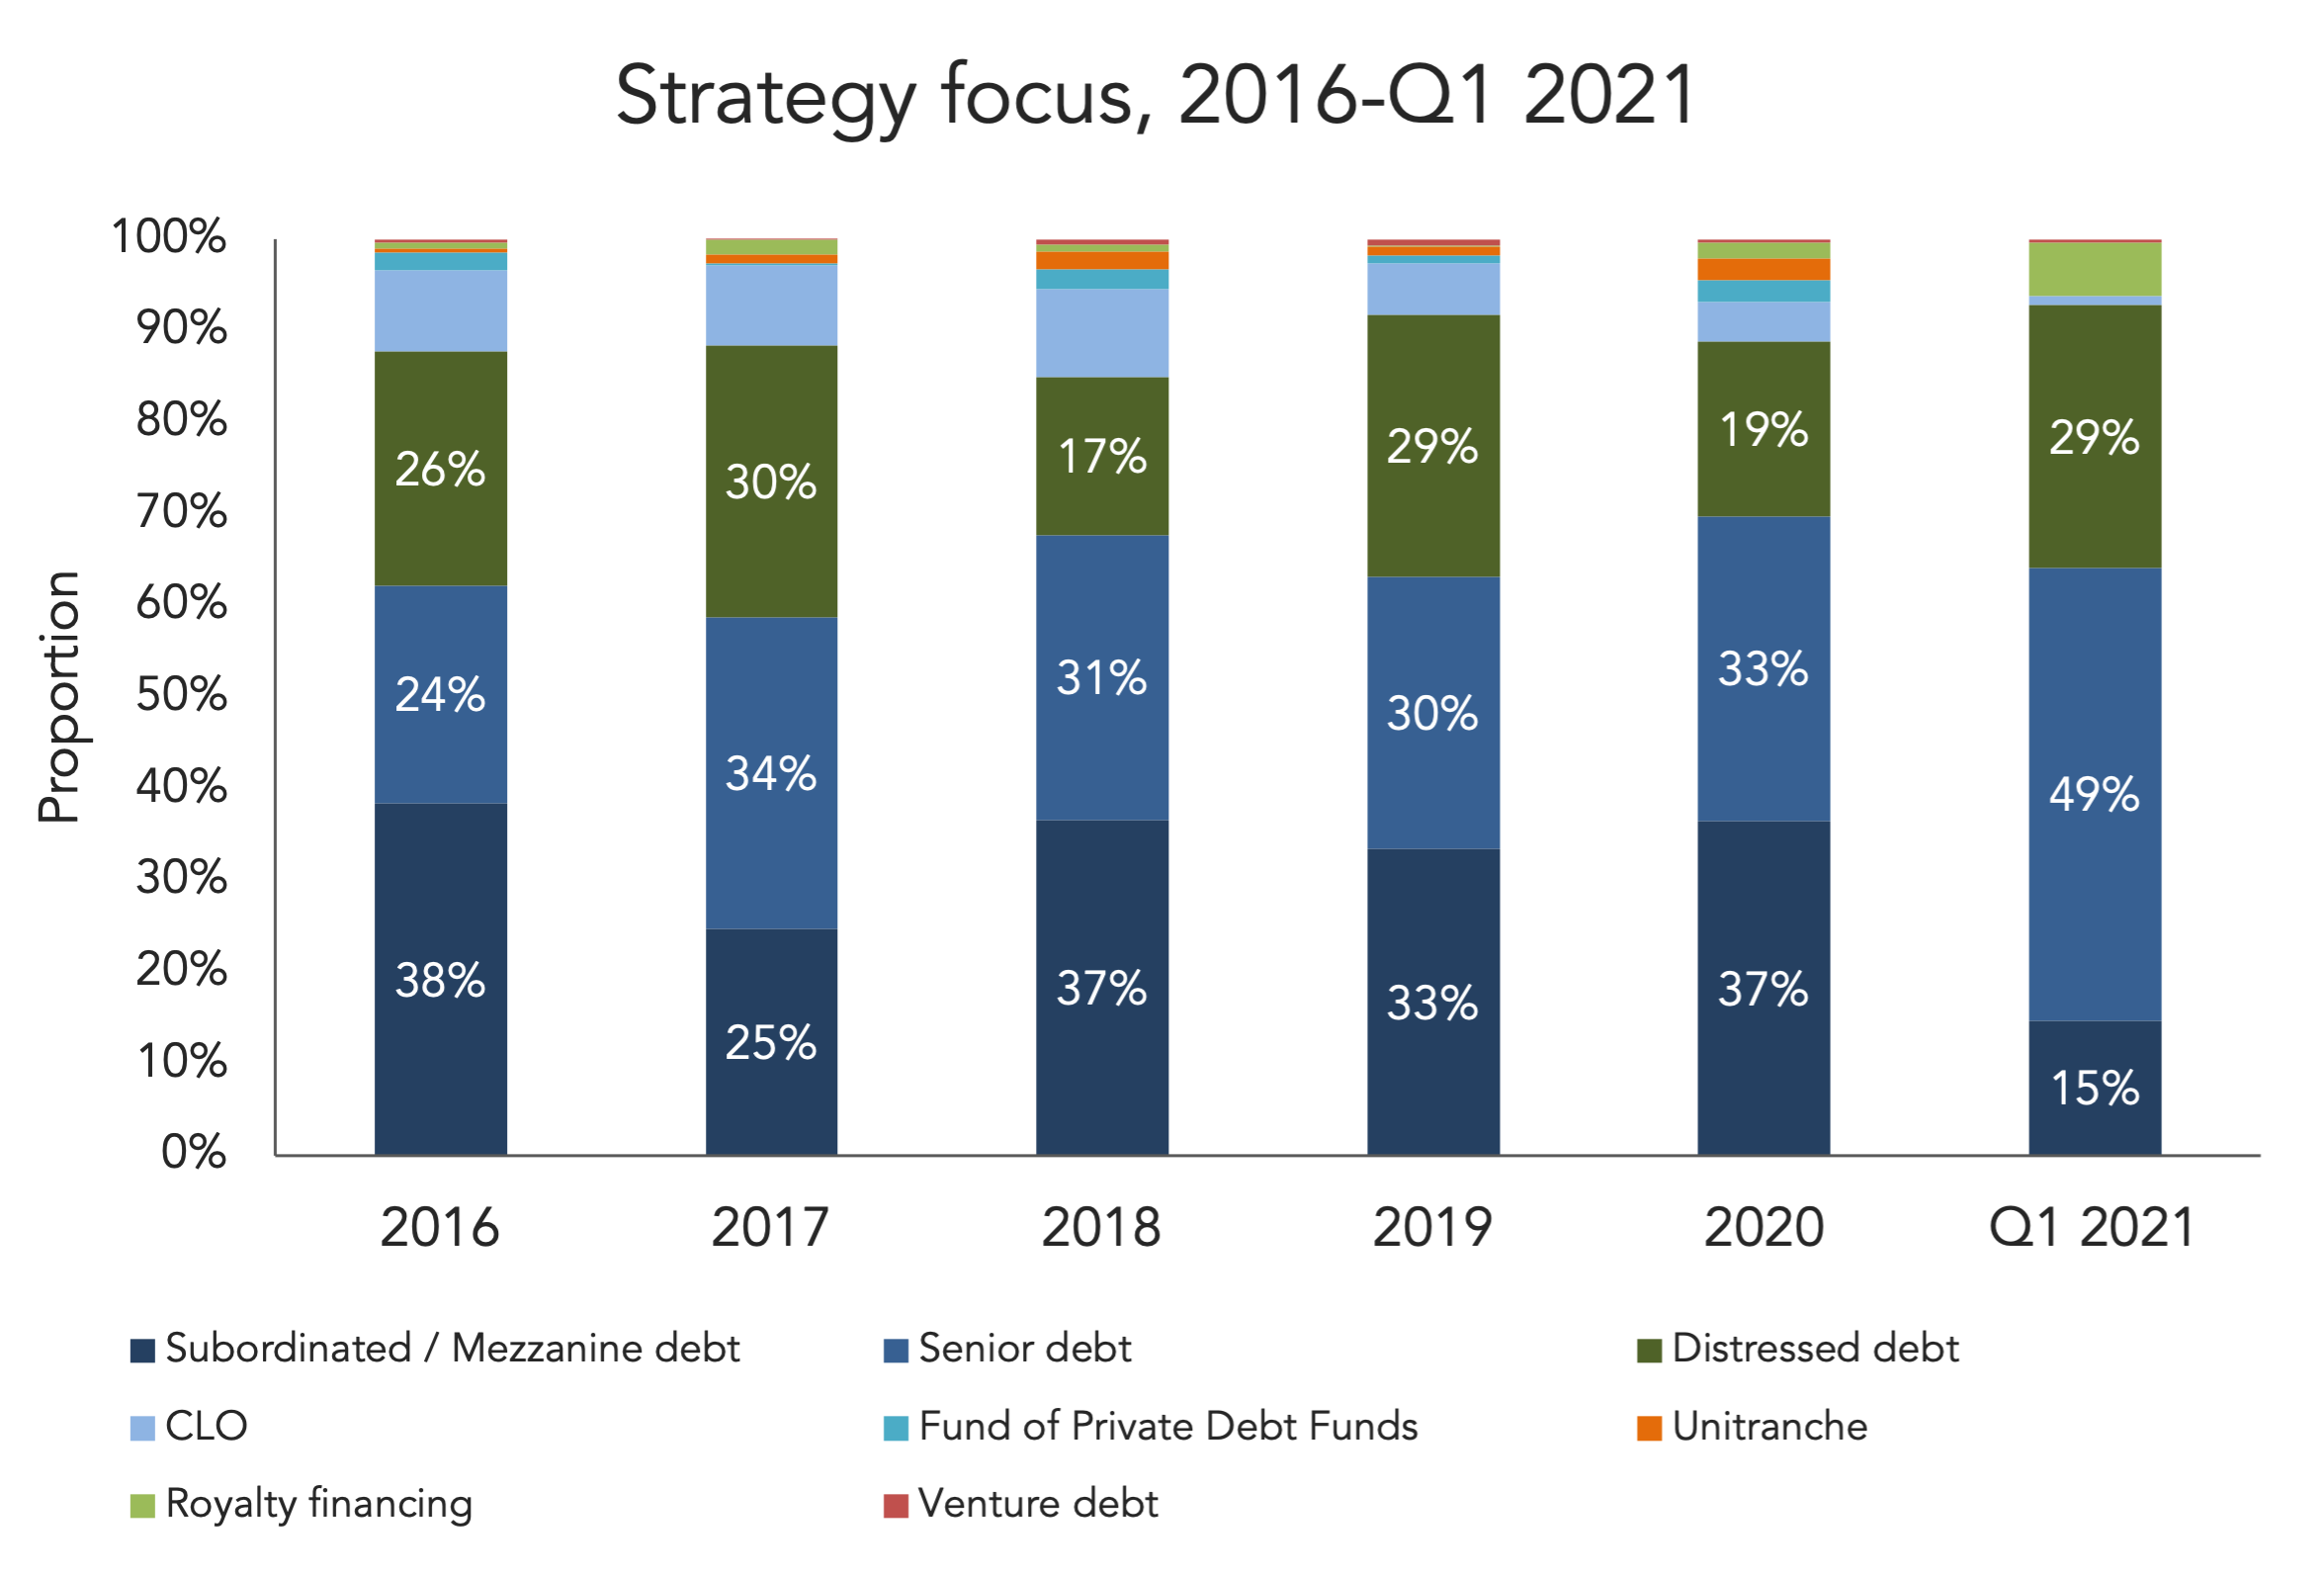
But underneath the headline figures there is some good news – especially for managers with senior debt-focused strategies. These managers saw their share of fundraising capital rise to almost half of the total (see chart above). This compares with an average share for senior debt of just over 30 percent between 2016 and 2020. Last year showed signs of a pick-up as the senior debt total edged up to 33 percent.
Of course, you can never claim a trend is established over a short timeframe, but there are solid reasons why senior debt is currently at a high level of popularity. For one thing, it’s natural for investors to gravitate to what is perceived to be the safest part of the capital structure in times of volatility. In addition, a Q2 “House View” from Investcorp Credit Management released this week said that “in the current period of rising rates and inflation, senior loans are an attractive asset class given their low duration and floating rate nature and should outperform in Q2”. No wonder then that LPs fancy a slice of the cake.
The chart above also shows investors willing to take a punt on distressed debt – always a tricky bet in terms of getting the timing right. Distress accounted for 29 percent of capital raised in the first quarter compared with an average between 2016 and 2020 of 24 percent. Helped by the liquidity that has been pumped into the system, defaults have remained at a reasonably low level so far. But the figures indicate not everyone believes all the problems have now been left behind.
(Past performance is no guarantee of future results.)




Latest news


PE fund distribution rates
Following 2021, buyout distribution rates have fallen to roughly 10% to 15% below the 25-year average.

Sub line pricing flattens
A report on the topic also finds that investors are less concerned by leverage in NAV loans. Pricing for subscription…