


Private Debt Intelligence – 11/4/2019

Infrastructure Debt Reaches Momentum
Chart
Download Data
[wpdm_package id=’29716′]
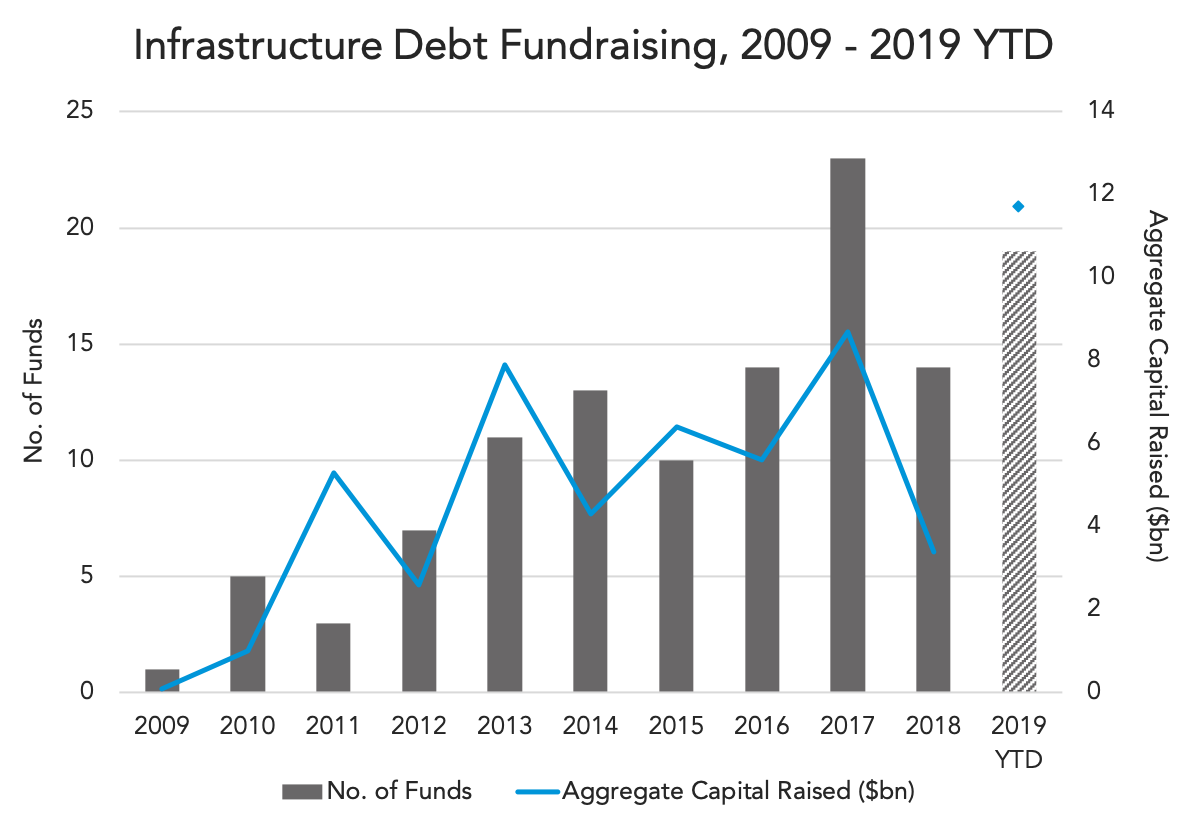
Debt providers in more specific sectors have started to take the place of traditional lenders, as for example in the infrastructure industry. Banks are no longer the main source, and investors are moving towards funds to gain access to the capital structure. Infrastructure debt fundraising has had peaks and troughs over the last ten years, but the last three have been the most pronounced, leaving 2019 going up high. Is the market expecting to break a record this year?
Until now, 2017 marked the highest peak in funds closed (23) and in capital secured ($8.7bn). Over the last year, it appears the appeal of debt declined sharply – 14 funds were closed and just $3.4bn were raised. But in 2019 fundraising is rapidly increasing; as at the end of October, 19 funds have been closed raising $11.7bn of capital, the highest amount ever seen in infrastructure debt. Q4 will already be the quarter with more capital secured in the year due to a mega fund closed on the 21st of October: AMP Capital Infrastructure Debt Fund IV, closed with $4bn. Also, Q2 marked this increase in fundraising, with another mega fund closed: EIG Energy Fund XVII, which secured $3.1bn.
Dry powder has continued rising over the years and has doubled since the end of 2015. As at November 2019, infrastructure debt is estimated to be standing at $27.8bn which is the highest amount over the last 10 years. The accumulation in dry powder coincided with the year of the fundraising peaks, although since 2017 it hasn’t stop increasing. In this regard, fund managers would need to allocate more capital if they want to maintain the fundraising trend.
Contact: Maria Zapata
maria.zapata@preqin.com


Latest news

Share of PE middle-market deal count by backing type
Add-ons remain the workhorse for middle-market deployment, accounting for 67. 1% of all middle-market transactions YTD, in line with activity seen in recent years.

Software deal share falls in middle markets, rises in large caps
In Q3’26 software’s share of total deals fell in both the Lower Middle Market (to 7%) and Upper Middle Market (to 9%), while Large Cap saw a modest uptick in share to 8%.

Secondary loan prices stabilize following steep declines
Secondary loan prices came under significant pressure through September and October, with the Bloomberg U.S. Leveraged Loan Index declining 119…